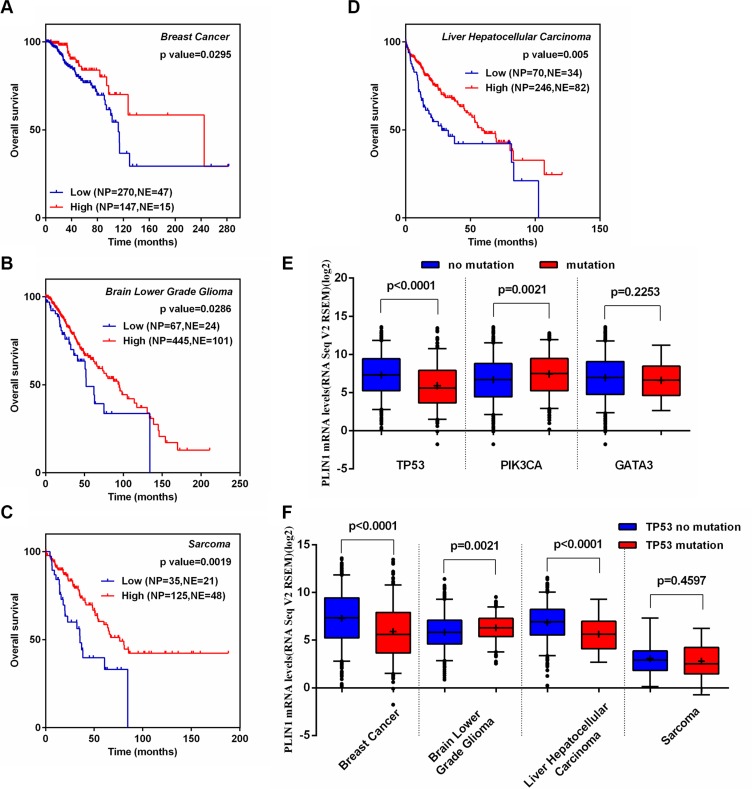
Figure 6. Correlation of PLIN1 expression with disease outcome in several human cancer types and TP53 somatic mutations.
(A–D) Kaplan-Meier survival curves for the patients with low or high levels of PLIN1 in breast cancer (A), low-grade glioma (B), sarcoma (C) and hepatocellular carcinoma (D). (E) Association of PLIN1 expression with somatic TP53, PIK3CA and GATA3 mutations in breast cancer. (F) Association of PLIN1 expression with somatic TP53 mutations in 3 other human cancers. All datasets were obtained from cBioPortal.

