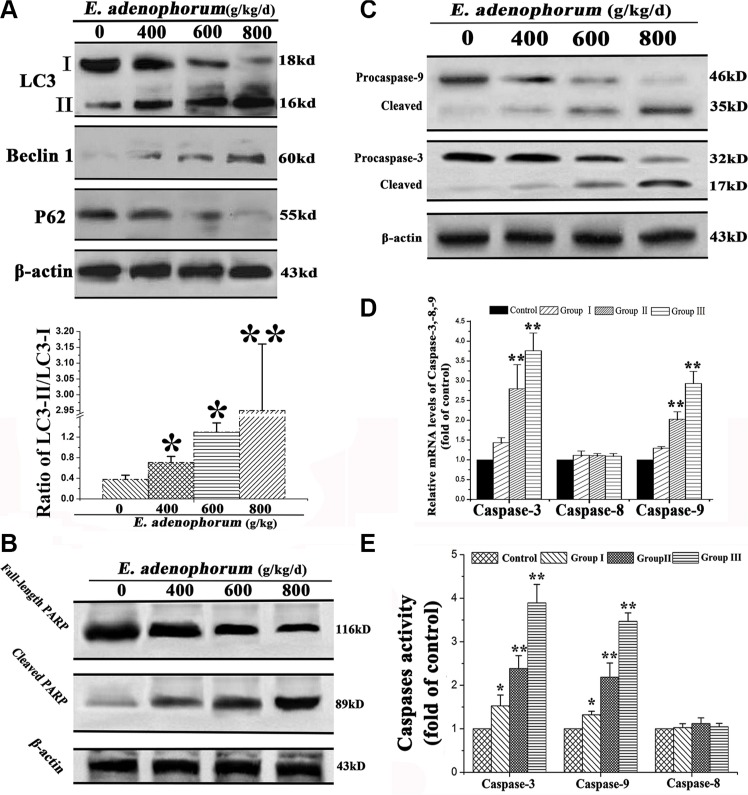
Figure 3. The autophagy and apoptosis were activated by E. adenophorum.
(A) The autophagy was triggered by E. adenophorum in hepatocytes. The representative blots show the expression levels of LC3-I, LC3-II, Beclin 1 and p62 in hepatocytes treated with E. adenophorum. β-actin was used as the internal control. Bar graph shows the ratio of LC3-II/LC3-I. (B) E. adenophorum activated apoptosis of hepatocytes. The hepatocytes were subjected to western blot analysis to detect full-length and cleaved PARP. (C) The protein levels of procaspase-3, -9 and the cleaved form of them which were shown with β-actin as a control were detected by Western-blot analysis. (D) The total mRNA was extraced and the relative mRNA levels of caspase-3, -8 and -9 were detected through qRT-PCR assay. (E) Caspase activities in E. adenophorum-treated hepatocytes. BCA assay was used to equal protein amounts and the enzymatic activities of caspases-8, -9, and -3 were measured using the colorimetric assay kits. All data are presented with the means ± SD and mean values of three independent experiments. *p < 0.05, compared with the control group; **p < 0.01, compared with the control group.

