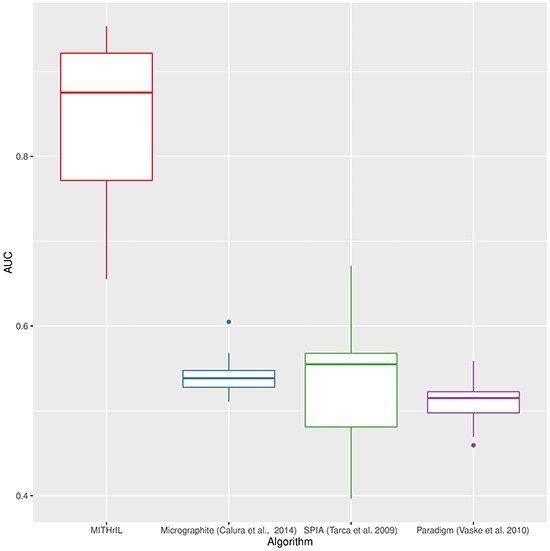
Figure 1. Performances comparison between MITHrIL, SPIA, micrographite and PARADIGM by means of the average area under the ROC curves.

Each box in the figure represents the variability range of AUC values for a specific methodology.

Each box in the figure represents the variability range of AUC values for a specific methodology.