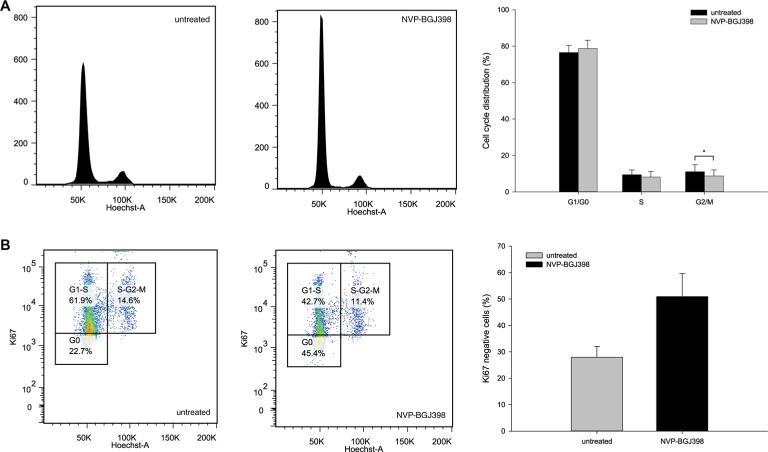
Figure 4. Treatment with NVP-BGJ398 affects cell cycle distribution by increasing the number of cells in G0 of the cell cycle.
(A) Inhibition of FGFR causes a small but significant (p-value < 0.05) change in G2/M phase distribution between cells treated with 100 nm NVP-BGJ398 and untreated (DMSO) cells. (B) Treatment with NVP-BGJ398 leads to a higher number of cells to accumulate in G0 within the G0/G1-S fraction of the cell cycle as compared to untreated (DMSO) cells. (A–B) Cells were treated with 100 nM of NVP-BGJ398 for 72 h. Representative plots (left) and bar graphs (right) of five independent experiments (n = 5) shown, error bars represent the standard deviation (SD) from five independent experiments. Student's t-Test. *p ≤ 0.05. p-value was determined as described in the Methods section.

