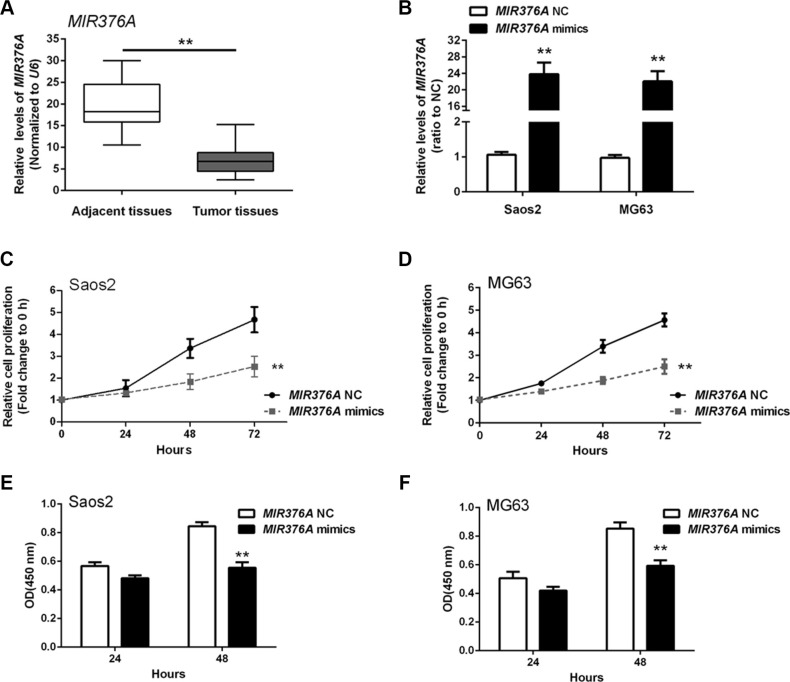
Figure 3. MIR376A suppression of osteosarcoma cell growth in vitro.
(A) Expression of MIR376A was downregulated in OS tissues compared with adjacent normal tissues. (B) MIR376A mimics were used to achieve MIR376A overexpression as confirmed by real-time qPCR in Saos2 and MG63 cell lines. (C and D) Cell growth of both Saos2 and MG63 cell lines were reduced in response to MIR376A overexpression compared with MIR376A NC group. (E and F) Results from BrdU incorporation assays indicated that MIR376A overexpression markedly reduced DNA synthesis in both Saos2 and MG63 cell lines compared with the MIR376A-NC group. Data are presented as mean ± SD of three independent experiments.

