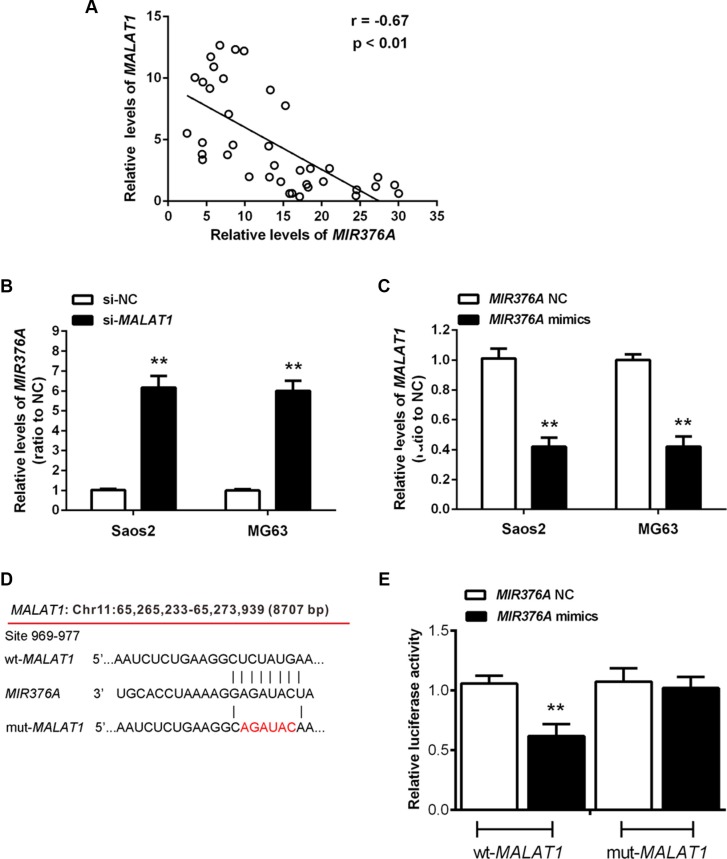
Figure 4. Inverse association of MIR376A with MALAT1 expression in osteosarcoma tissues and direct interaction between MIR376A and the 3′UTR of MALAT1 in vitro.
(A) An inverse correlation between MALAT1 and MIR376A expression was observed. (B) Real-time PCR assay showed that knockdown of MALAT1 caused upregulation of MIR376A. (C) MALAT1 expression was decreased in response to MIR376A overexpression, compared with the MIR376A-NC group. Data are presented as mean ± SD of three independent experiments. (D) Generation of wt-MALAT1 and mut-MALAT1 containing luciferase reporter vectors by sequentially mutating the predicted MIR376A binding site in the MALAT1 3′ untranslated region. (E) The wt-MALAT1/mut-MALAT1 vectors and MIR376A-NC/MIR376A mimics were co-transfected into Saos2 cells, respectively. Luciferase activity of the wt-MALAT1 vector was reduced in cells co-transfected with MIR376A mimics. Repression of luciferase activity by MIR376A was not shown in cells transfected with mut-MALAT1. Data are presented as mean ± SD of three independent experiments.

