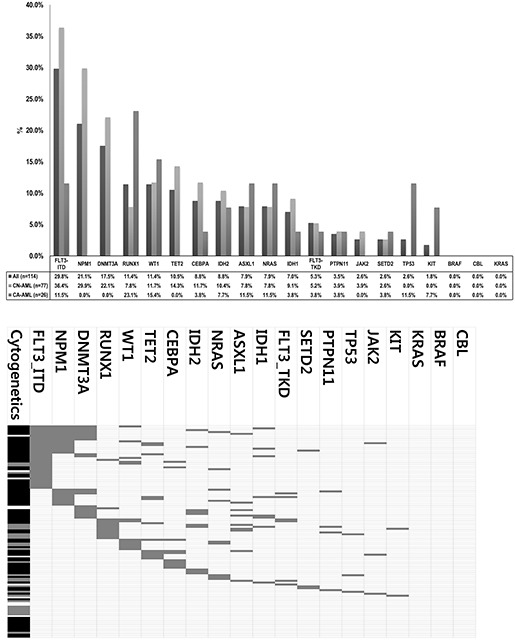
Figure 1. Mutational profiles of AML cases analyzed.

A. Mutation frequencies according to chromosome abnormalities. B. Mutation status in individual cases and co-occurrence among other mutations and chromosome abnormalities. Gray-color box indicates mutated case. For cytogenetic abnormalities, Black-color box indicates CN-AML, Gray-color box indicates CA-AML, White-color box indicates other AML (i.e. unknown cytogenetics).
