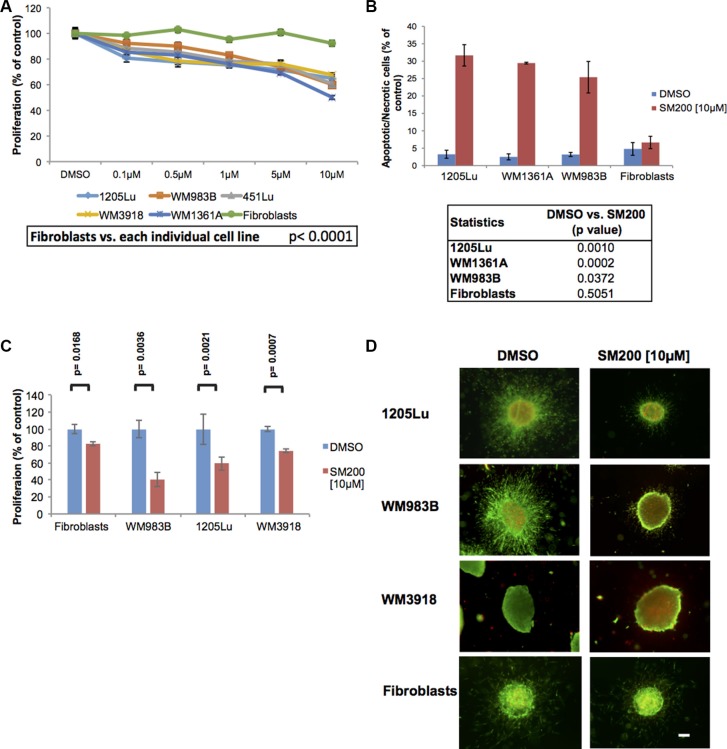
Figure 1. SM200 inhibits proliferation and invasion of 2D and 3D melanoma cells.
(A) Melanoma cells and normal fibroblasts were treated with increasing doses of SM200 for 72 h, then were assessed using the alamarBlue assay. Results were normalized to the DMSO control. Data are represented as mean +/− SEM. A significant response to SM200 was detected for all melanoma cell lines compared to the fibroblasts (p < 0.0001). (B) Melanoma cell lines and normal fibroblasts were treated with SM200 [10 μM] for 72 h before staining with propidium iodide. All treated melanoma cell lines show a significant increase in cytotoxicity, but not fibroblasts. Data are represented as mean +/− SEM, and p-values are provided in the table below. (C) The AlamarBlue assay was conducted on collagen-embedded melanoma spheroids treated with SM200 for 72 h to assess spheroid growth. Data are represented as mean +/− SEM, from triplicate experiments and p-values are provided. (D) Collagen-embedded melanoma spheroids were treated for 72 h with SM200 [10 μM] and stained for live and dead cells. Green fluorescence indicates metabolically active (live) cells, red fluorescence indicates membrane compromised (dead) cells. Experiments were conducted in triplicate and representative images are shown. Scale bar represents 150 microns.

