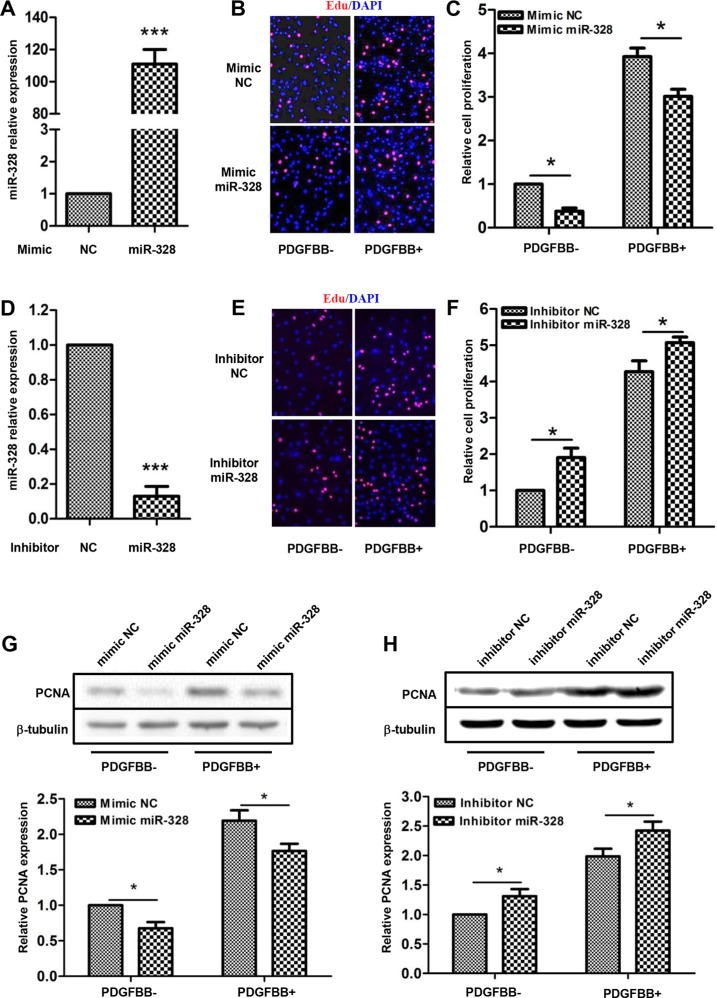
Figure 2. miR-328 inhibits PASMCs proliferation.
The relative expression of miR-328 was analyzed in PASMCs transfected with miR-328 mimic or inhibitor by quantitative PCR, as compared with their negative control (NC) (A and D); ***P < 0.001 compared to NC. The proliferation of PASMCs was measured by EdU incorporation assays. Representative images of EdU labeling showing proliferation of PASMCs transfected with either miR-328 mimic (B) or inhibitor (E) with and without PDGFBB stimulation. The quantifications were shown to better view the difference between different treatments (C and F). The protein level of PCNA was detected by Western blotting, and b-tubulin was used as internal control. Representative results of immunoblots and their quantifications were shown (D and H). Data are presented as means ± SD with three independent experiments; *p < 0.05 compared to control without PDGFBB treatment (PDGFBB-).

