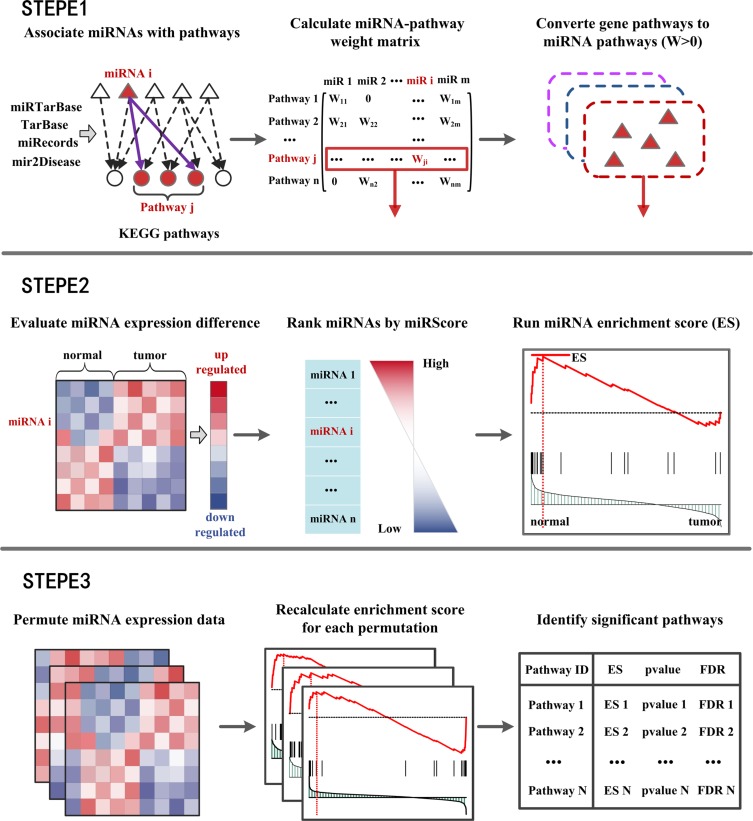
Figure 1. Flow diagram of MiRSEA methodology.
(STEPE 1) miRNAs are associated with KEGG pathways according to four miRNA-target interactions databases. A miRNA-pathway weight matrix is calculated. Pathways of protein-coding genes are converted into pathways of miRNAs with miRNA-pathway weights larger than zero. (STEPE 2) For each pathway, the differential expression level of miRNAs and miRNA-pathway weights are integrated into a vector miRScore, and a ranked miRNA list is formed based on the miRScore. MiRNAs in the converted pathway are mapped to the ranked miRNA list, and the miRNA enrichment score of the pathway is calculated by walking down the list. (STEPE 3) A permutation test is performed on the miRNA expression data, and pathways are prioritized by FDR after permutation tests.

