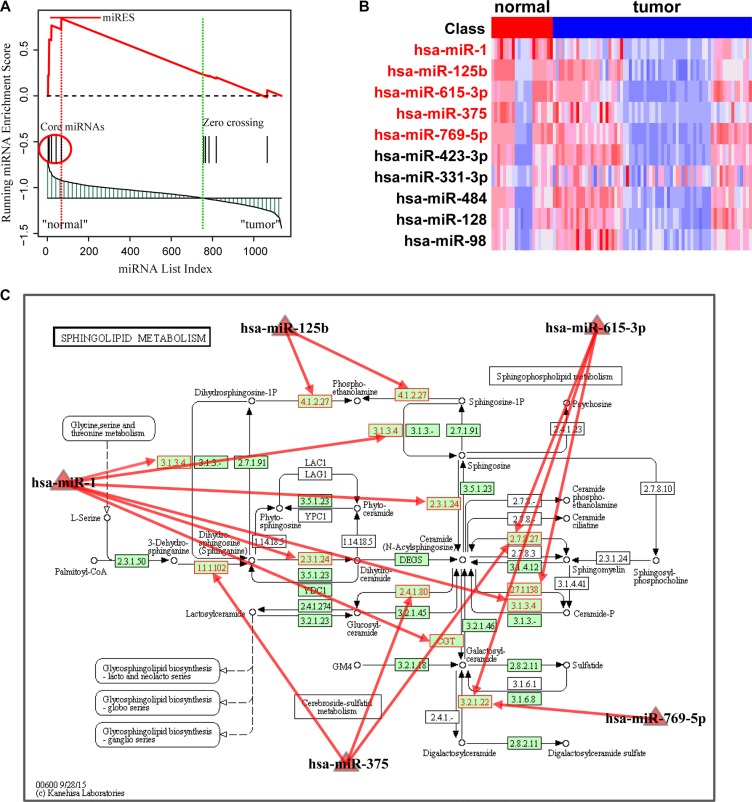
Figure 2. Running enrichment scores and annotating target genes of core miRNAs in the sphingolipid metabolism pathway.
(A) Running-sum statistic is calculated by walking down the miRNA list, and the maximum deviation from zero of the statistic is used as the miRNA enrichment score (miRES) of the pathway. (B) Heatmap of the expression levels of miRNAs in the pathway. Core miRNAs are marked in red. (C) Sphingolipid metabolism pathway in KEGG. Core miRNAs are mapped to the pathway and the target genes of core miRNAs are annotated in red.

