
Figure 2. Inhibitory mechanisms of MLN0128 on AML cell lines (A) and on a representative primary AML sample (B).
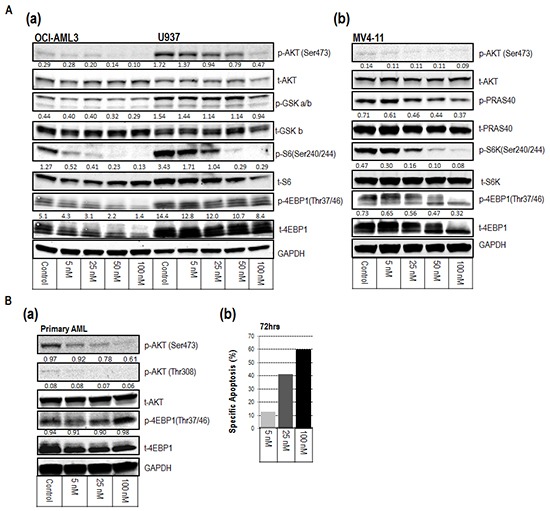
A (a-b). and B (a). Western blot revealed the inhibition of downstream targets of mTORC1 and mTORC2 at the indicated concentrations of MLN0128 for 1 hour. Protein intensity was quantified. The intensity of phosphorylated protein was calculated using the formula: p-protein/t-protein/GAPDH x 100, except for p-4EBP1 in (a), which used p-protein/GAPDH x 100. Results are displayed under the blot of phosphorylated protein. p-protein = phosphorylated protein; t-protein = total protein. B (b). Bar graph displays the specific apoptosis induction of the same sample at 72 hours.