
Figure 3. CyTOF identifies Inhibitory effect of MLN0128 on AML stem/progenitor cells.
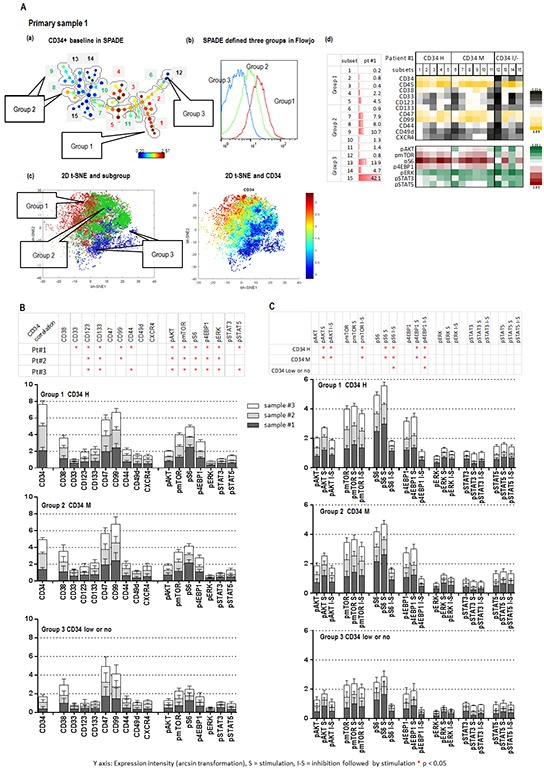
A (a). SPADE displays patient #1 CD34 baseline expression. Subsets containing the similar intensity of CD34 were grouped as indicated (groups 1, 2 and 3). The defined groups were confirmed by a FlowJo histogram graph A (b). and a viSNE 2-D plot A (c). (A (d) left): cell frequency of defined subsets. (A (d) right): baseline expressions of surface and intracellular molecules of defined subsets of three groups. B. The expression intensities of surface and intracellular molecules in subsets of each group (groups 1, 2, and 3) of three samples (1, 2, and 3) are displayed in stack bar graphs. The y-axis shows: expression intensity (arcsin transformation). Table on the top summarizes the correlation between CD34 and surface and intracellular molecules. An asterisk indicates a significant correlation. C. Effect of SCF (S = Stimulation) and MLN0128 (I = Inhibition) on defined subsets of three groups in three samples. The expression intensity of intracellular molecules before and after SCF and that of MLN0128 followed by SCF (I-S) in the defined subsets of each group of three samples are displayed in stack bar graphs. Significant stimulation (before and after SCF) and inhibition (SCF with or without MLN0128) of intracellular molecules in each CD34 expression group of three samples are summarized in the table on top of the stack bar graphs. *: significance (p < 0.05).