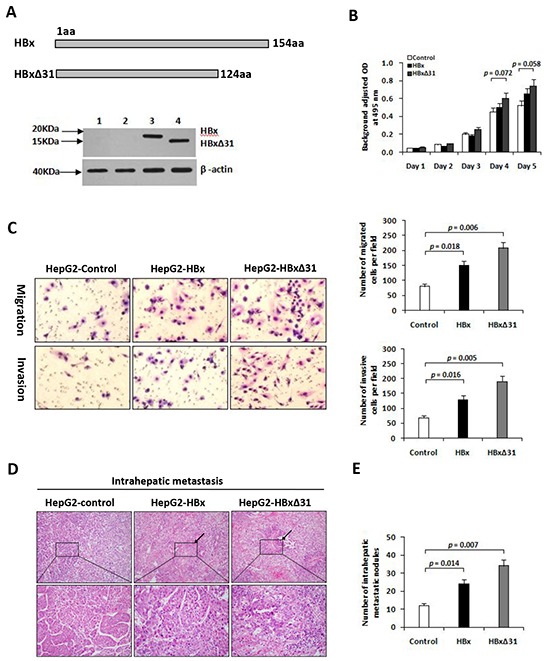
Figure 2. Over-expression of HBxΔ31 in HepG2 enhanced cell invasion and tumor metastasis.

A. Schematic diagram showing the different constructs of HBx used in this study. Western blot analysis of HBx expression in HepG2 cells stably transfected with HA-tagged HBx- or HBxΔ31-expressing plasmid and control vector pRc/CMV. β-actin was used as loading control. 1) Parental HepG2, 2) pRc/CMV, 3) Full-length HBx, 4) HBxΔ31. B. The growth rates of HBxΔ31- expressing cells was significantly increased compared to vector control, but had no effect on that of full-length HBx-expressing cells. C. The number of migrated or invaded cells was significantly increased in HBxΔ31-expressing cells, as compared to full-length HBx-expressing or vector control cells. Bars represent the numbers of migrated or invaded cells per field under 100 magnification. D, E. In vivo metastasis assay. (D) Representative images of livers from the different groups is shown. Black arrows indicate the intrahepatic metastatic tumors. (E) The number of metastatic nodules in the liver were counted and analyzed with Student's t-test (six mice per group). Results are derived from triplicate independent experiments (±SD).
