
Figure 1. FZD7 in primary GBM: expression and scoring system.
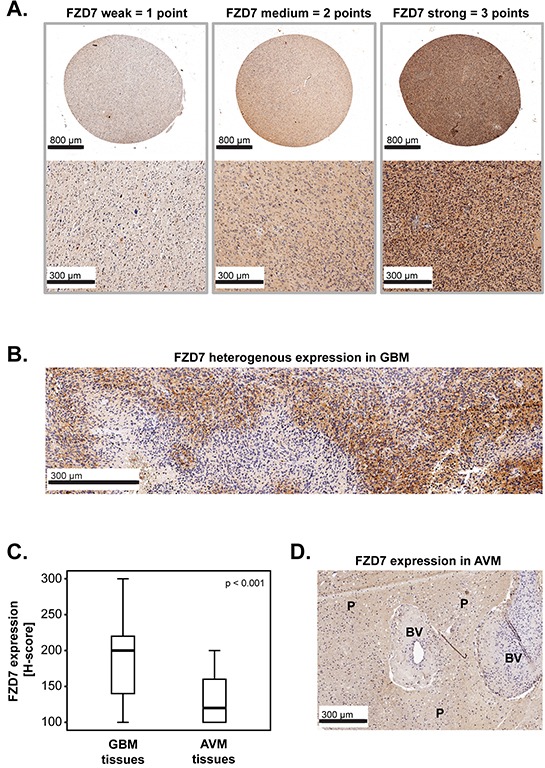
A-B. Representative micrographs showing (A) weak, medium or strong expression of FZD7 and (B) heterogenous expression of FZD7 in GBM tissues. Scale bars are indicated in the lower-left corner of each panel. C. FZD7 expression in GBM tissues (n=222) versus non-cancerous brain tissues (brain parenchyma from patients with arteriovenous malformations-AVM; n=52). The medians are shown as black lines and the percentiles (25th and 75th) as vertical boxes with error bars. Statistical analysis was performed with the chi-square test and the p-value is indicated in the upper right corner of the plot. D. Representative micrograph showing FZD7 expression in AVM tissues. The scale bar is indicated in the lower-left corner of the panel. BV= blood vessels; P=brain parenchyma.