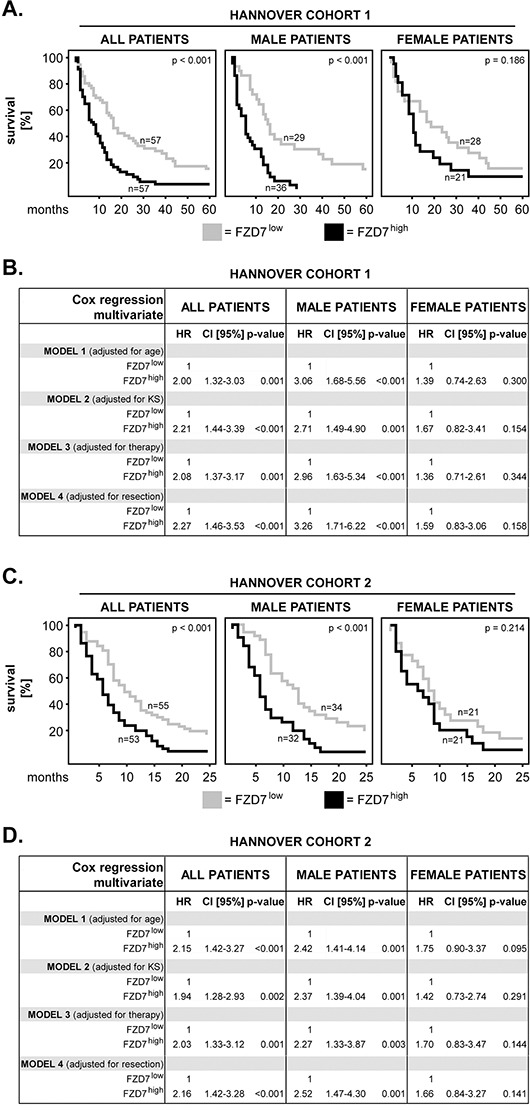
Figure 2. FZD7 in primary GBM: impact on patients’ overall survival and sex differences.

A. Kaplan–Meier 5-year survival curves were plotted for the Hannover Cohort 1 patients with low versus high levels of FZD7. Analysis was performed for the entire cohort of patients (all patients), male and female patients, respectively. The log-rank test was used for statistical testing and the p-values are indicated in the upper-right corner of each plot. The numbers of patients per group are indicated next to each curve. B. Multivariate Cox regression analysis models for the Hannover Cohort 1 patients with FZD7low versus FZD7high. The models were adjusted for age, Karnofsky scale (KS), therapy and extent of surgical resection, respectively. HR = hazard ratio; 95% CI = 95% confidence interval. C. Kaplan–Meier 2-year survival curves were plotted for the Hannover Cohort 2 patients with low versus high levels of FZD7. The statistical testing was performed as in (A). D. Multivariate Cox regression analysis models for the Hannover Cohort 2 patients with FZD7low versus FZD7high. The statistical testing was performed as in (B).
