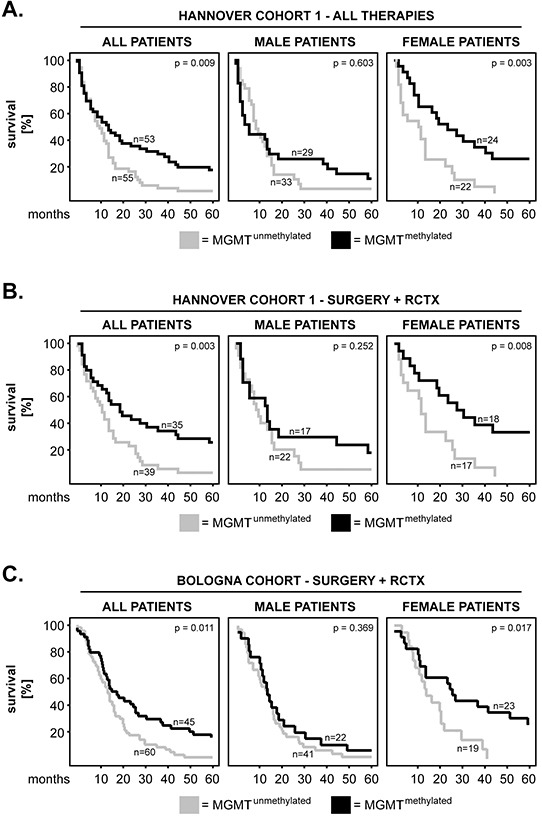
Figure 3. MGMT methylation in primary GBM: impact on patients’ overall survival and sex differences.

A-B. Kaplan–Meier 5-year survival curves were plotted for the Hannover Cohort 1 patients with methylated versus unmethylated MGMT promoter. Analysis was performed for (A) all therapy groups and (B) only the group which received radiochemotherapy (RCTX) in addition to surgery. C. Kaplan–Meier 5-year survival curves were plotted for the Bologna patients with methylated versus unmethylated MGMT promoter. All patients in this cohort had received RCTX in addition to surgery. The p-values of the log-rank test are indicated in the upper-right corner of each plot. The numbers of patients per group are indicated next to each curve.
