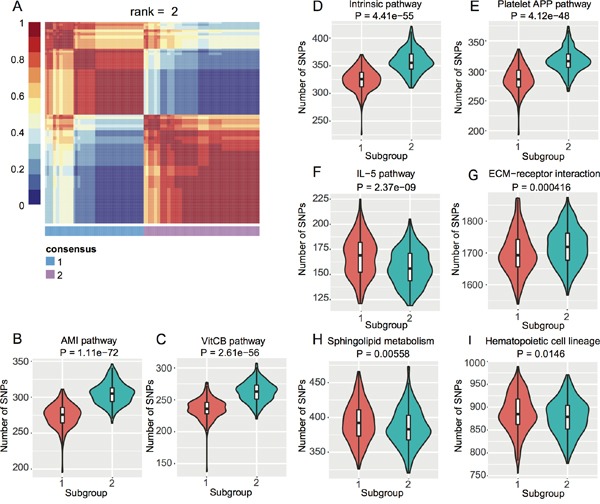
Figure 2. NMF-based subgroups of EC GWAS cohort.

A. Heat map of consensus matrix when rank = 2, where two consensus subgroups are observed. B. ~ (I) Violin plots of each pathway with t-test P < 0.05 between the two subgroups from (A).

A. Heat map of consensus matrix when rank = 2, where two consensus subgroups are observed. B. ~ (I) Violin plots of each pathway with t-test P < 0.05 between the two subgroups from (A).