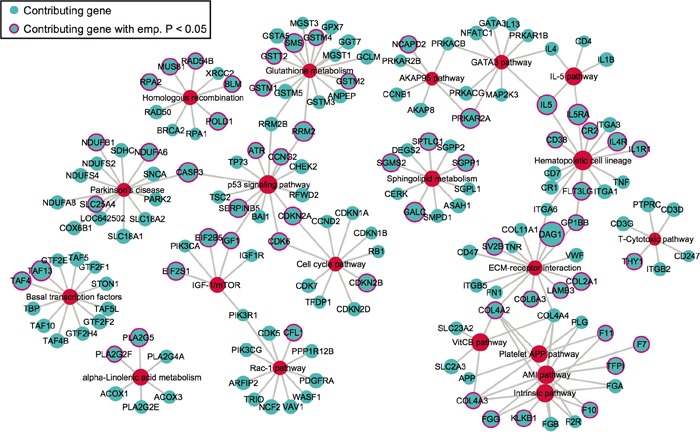
Figure 3. The network of top 20 pathways and their genes.

Genes (blue) are mapped from contributing SNPs in PLINK set-based test. The significance level of a gene or pathway (red) is represented by the size of the node, based on the log0.05 transformed. Genes with pink outlines are significant with empirical p-value < 0.05.
