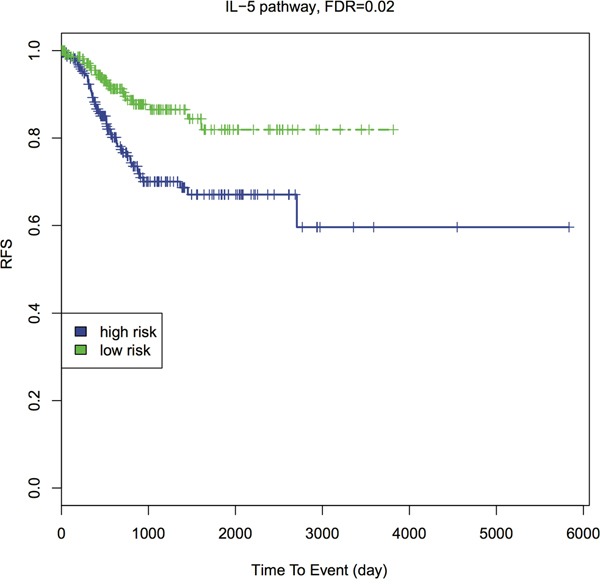
Figure 4. Kaplan-Meier survival curves of IL-5 pathway with FDR.

Patients are dichotomized by the median PDS into higher- vs. lower- risk groups. The Wilcoxon log-rank p-value is calculated to detect the survival difference between these two groups, then adjusted by FDR.
