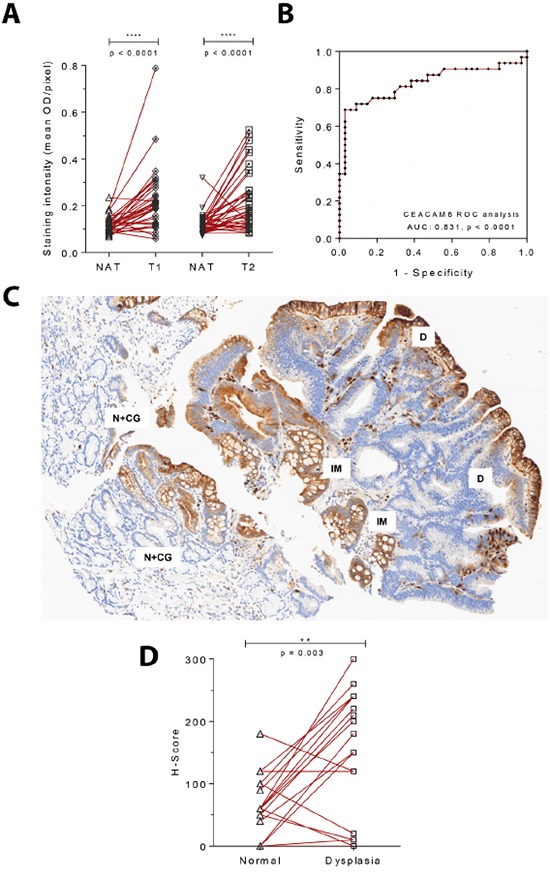
Figure 4. CEACAM6 is upregulated in both early gastric cancers and dysplastic lesions of the stomach.

A. CEACAM6 IHC staining of an early gastric adenocarcinoma tissue microarray with matched normal adjacent tissue (clinical stage 1 - T1N0M0 and T1N1M0=32, T2N0M0=39). Paired t test. B. ROC analysis of CEACAM6 staining in T1 early gastric cancer shows an AUC of 0.831 for the identification of early gastric cancer from adjacent normal tissue. C. A representative image of CEACAM6 staining in a region of dysplasia depicting increase in staining intensity from normal gastric glands showing mild chronic gastritis (N+CG) to intestinal metaplasia (IM) to dysplasia (D). Scale bar=100μm. D. Quantitation of the H-Score for CEACAM6 in 20 cases of dysplasia with adjacent normal tissue performed by a histopathologist. A significant increase in CEACAM6 staining is observed in dysplastic regions. Paired t test.
