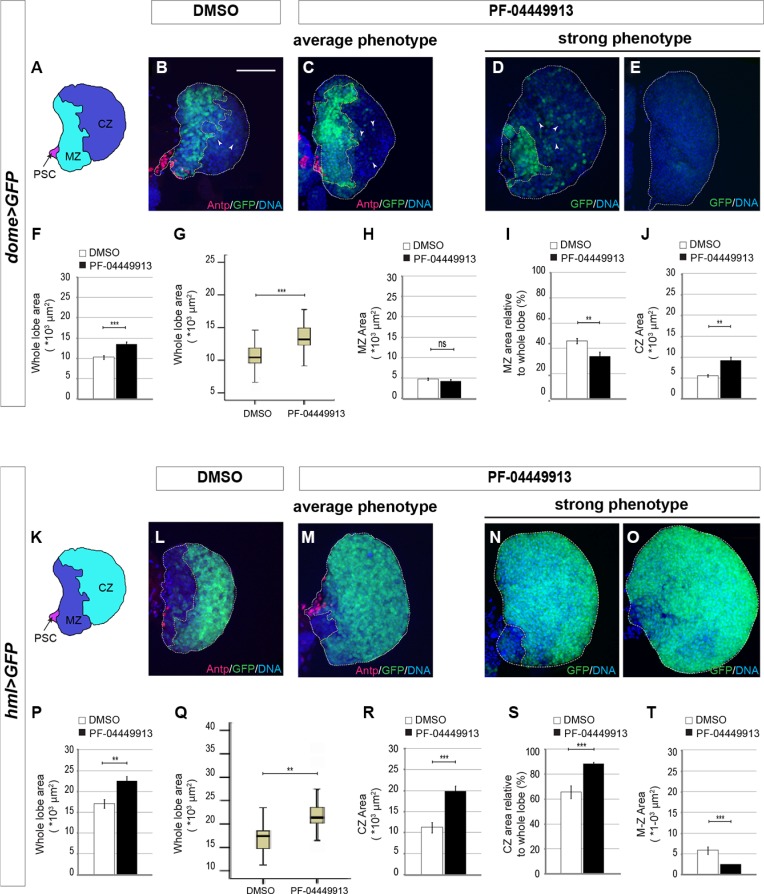
Figure 6. Smo inhibition upon PF-04449913 administration induces loss of hematopoietic precursor cells of the lymph gland medullary zone.
(A) Schematic drawing of a m-L3 lymph gland primary lobe. MZ: medullary zone (green); CZ: cortical zone (blue); PSC: posterior signaling center (red). (B–E) Lymph gland primary lobes from domeGal4:UAS-GFP/+ m-L3 larvae (dome > GFP). Primary lobes are labeled by GFP in the hematopoietic precursors of the MZ, and by a DNA dye (blue). In B and C, lobes and MZ of average size from DMSO (B) and PF-04449913 treated animals (C) are labeled by an anti-Antp antibody to show the PSC cells (red). In D, E primary lobes showing a strong and incompletely penetrant phenotype in PF-04449913 treated larvae. (F–J) Quantification of the average whole primary lobe area (F), box plot showing the dispersion of the single values analyzed in F (G), absolute MZ area (H), MZ relative to whole lobe area (I), CZ area (J). White arrowheads in B–D indicate cells expressing low GFP level at the CZ position. (K) Schematic drawing of a m-L3 larval lymph gland primary lobe. MZ: medullary zone (blue); CZ: cortical zone (green); PSC: Posterior Signaling Center (red). (L–O) Lymph gland primary lobes from hemolectin-Gal4:UAS-GFP/+ larvae (hml > GFP). Primary lobes are labeled by GFP in the differentiating hemocytes of the CZ, and by a DNA dye (blue). In L and M, lobes and CZ of average size from DMSO (L) and PF-04449913 treated animals (M) are also labeled by an anti-Antp antibody to show the PSC cells position (red). In N and O primary lobes displaying a strong and incompletely penetrant phenotype in PF-04449913 treated larvae. (P–T) Quantification of the average whole primary lobe area (P), box plot showing the dispersion of the single values analyzed in P (Q), absolute CZ area (R), CZ relative to whole lobe area (S), MZ area (T). For each condition the quantitative analysis is based on 18–21 primary lobes from 10–13 dome > GFP or hml > GFP larvae. All lymph glands are dissected from m-L3 larvae (75 h AEH at 24°C). Hoechst (blue) labels nuclei (DNA). Scale bar: 50 μm. All control lobes comes from larvae grown on DMSO-containing medium. The top and bottom along the Z-axis have been set to analyze the whole lobe. White columns correspond to control lobes, black columns show lobes from treated larvae. (**p < 0.001, ***p < 0.0001, ns = not significant). Error bars indicate s.e., except for the box plots in G and Q where the ends of the whiskers represent the minimum and the maximum value of the corresponding data.

