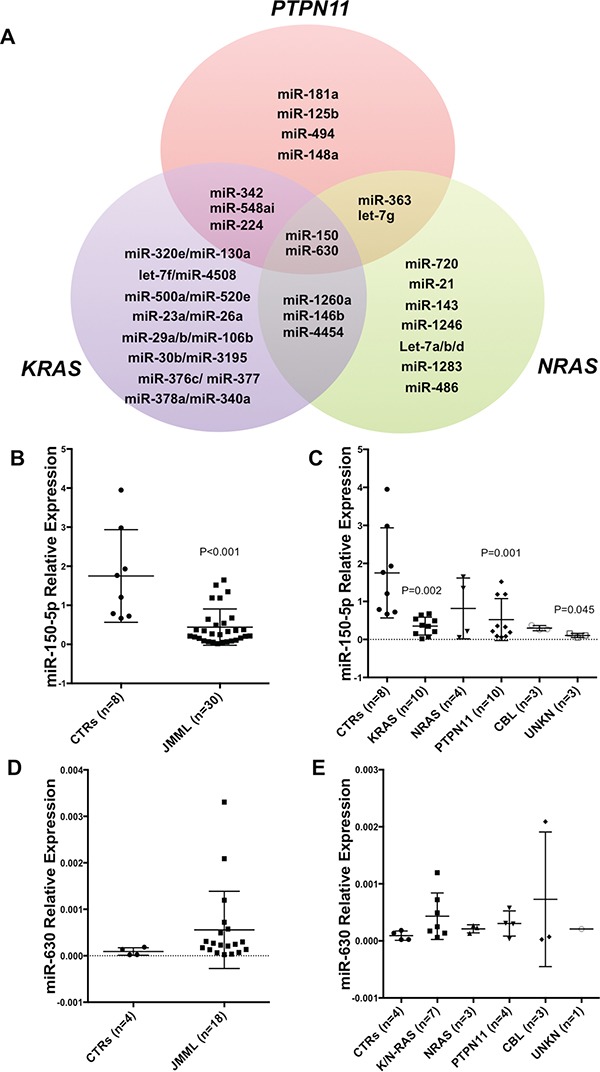
Figure 1. Deregulated microRNA Signature in JMML.

A. Venn diagram showing deregulated microRNAs (miRs) in JMML patients compared to controls. MiRs belonging to either PTPN11, KRAS and NRAS are shown in detail (See also Supplemental Table 1). CBL (n=3) and unknown patients (n=4) are not included due to low numbers of samples or unknown mutation status. B. Histograms showing miR-150-5p expression in a subset of JMML patients (n=30) vs controls (n=8) as measured by qRT-PCR (P<0.001). This subset of JMML patients was choosen based on the availability of RNA after the nCounter miR profiling. C. miR-150-5p expression according to the molecular subset of JMML and controls as measured by qRT-PCR (KRAS P=0.002; PTPN11 P=0.001; UNKN P=0.045). Results are shown as relative expression. D. MiR-630 expression in a subset of JMML patients (n=30) vs controls (n=8) as measured by qRT-PCR. E. MiR-630 expression according to the molecular subset of JMML and controls as measured by qRT-PCR. Results are shown as relative. P-values were calculated on three technical replicates using Unpaired two-tailed t-test. Unreported P-values are greater than 0.05 (P>0.05).
