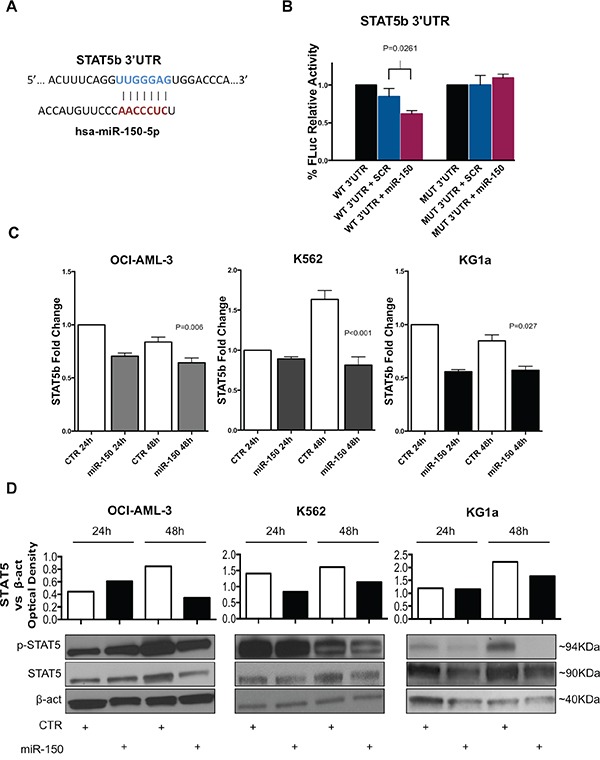
Figure 2. MiR-150-5p directly targets STAT5b.

A. Graph showing the interaction between the miR-150-5p seed sequence and the STAT5b 3′UTR. Pairing starts from 4462 to 4468 nuclotide (NM_012448; GenBank). B. Luciferase reporter assay for the interaction between STAT5b 3′UTR and miR-150-5p. Firefly Luciferase (FLuc) activities obtained from 293T cells co-transfected with wild type (WT) STAT5b 3′UTR construct and miR-150-5p mimic (P=0.026) or scrambled (SCR) oligonucleotides (control). Results are shown after normalization with Renilla Luciferaese. Mutant STAT5b 3′UTR contsructs (MUT) were also co-transfected with miR-150-5p mimic or SCR oligonucleotides. Results are representative of at least three independent experiments±SD. P-values were calculated using Unpaired two-tailed t-test. P-values greater than 0.05 (P>0.05) were not reported. C. STAT5b mRNA expression in OCI-AML-3 (P=0.006), K562 (P<0.001) and KG1a (P=0.027) cell lines after transfection with miR-150-5p or empty vector control (CTR) as measured by qRT-PCR. Results are shown as fold change in STAT5b mRNA expression with respect to control sample at 24 hours (CTR). D. Western Blotting analysis of Stat5, phosphorylated Stat5 (p-Stat5) and β-actin (loading control) expression in OCI-AML-3, K562 and KG1a cell lines after transfection with miR-150-5p or empty vector control (CTR). Densitometry plot shows STAT5 upregulation in cell lines. Optical density was calculated using β-actin as reference. Results are representative of at least two independent experiments. Densitometry histograms are relative to represented experiment below.
