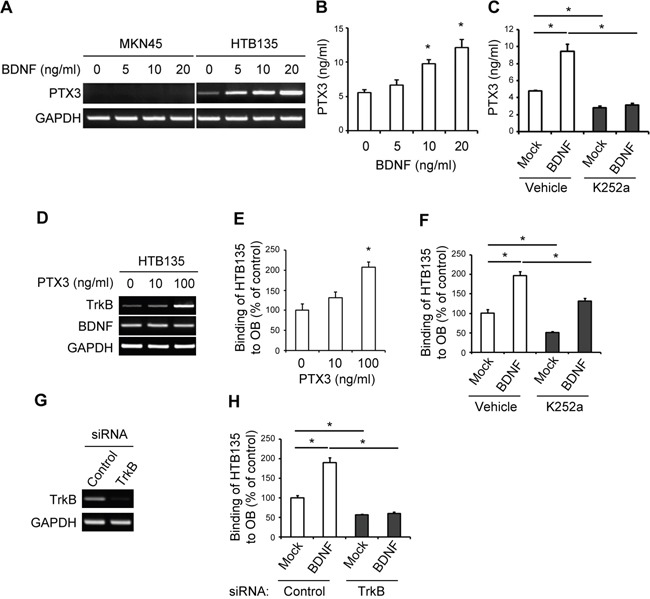
Figure 3. BDNF induces PTX3 expression and promotes bone metastatic gastric cancer cell binding to osteoblasts (OBs) via TrkB signaling.

A. BDNF induces a dose-dependent increase in PTX3 mRNA expression in HTB135 cells. MKN45 and HTB135 cells were treated with BDNF (0, 5, 10, and 20 ng/ml), and PTX3 mRNA expression levels were determined using RT-PCR. GAPDH was included as a control. B. BDNF triggers PTX3 protein secretion from HTB135 cells. PTX3 protein levels in conditioned media (CM) of HTB135 cells treated with increasing concentrations of BDNF for 48 h were evaluated with ELISA (*P <0.05 in comparison with vehicle control). C. BDNF-induced PTX3 upregulation is TrkB-dependent. HTB135 cells were pretreated with K252a (50 nM) and subsequently treated with BDNF (20 ng/ml). ELISA was performed to examine the concentration of PTX3 protein in CM. Data are shown as means ± standard deviations (SD; *P <0.05 in comparison with mock control). D. TrkB transcript levels increased upon PTX3 stimulation in HTB135 cells. HTB135 cells were treated with the indicated concentrations of PTX3. TrkB and BDNF mRNA expression levels were determined using RT-PCR. GAPDH was included as a control. E. PTX3 enhanced the binding of HTB135 cells to OBs. OBs were treated with different concentrations of PTX3 (0, 10, or 100 ng/ml), following which CellTracker™ Green 5-chloromethylfluorescein diacetate (CMFDA)-labeled HTB135 cells were layered onto OBs for 6 h. Thereafter, the ability of the HTB135 cells to bind to OBs following PTX3 treatment was evaluated using a fluorescent plate reader. Values represent the percentage of vehicle treatment (*P <0.05 in comparison with vehicle control). F. TrkB signal blockade attenuated the BDNF-induced increase in HTB135 cell binding to OBs. HTB135 cells were pretreated with K252a (50 nM) and subsequently treated with BDNF (20 ng/ml), following which the binding capacity of HTB135 cells for OBs was examined. Values represent percentages of the control. Data are shown as means ± SD (*P <0.05 in comparison with mock control). G. HTB135 cells were transfected with either negative control or TrkB specific siRNA and RT-PCR was performed to determine the level of TrkB mRNA. H. HTB135 cells were transfected with either negative control or TrkB targeting siRNA and treated with BDNF (20 ng/ml). The binding capacity of the HTB135 cells to osteoblasts was examined. Bars indicate the mean and standard deviations (SD) (*p < 0.05 in comparison with mock control). P values were obtained using Student's t test.
