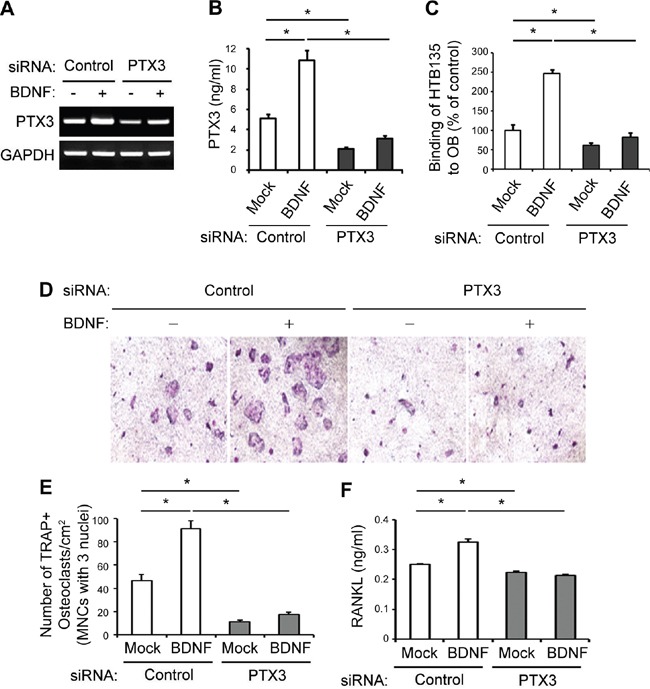
Figure 4. BDNF-derived PTX3 promotes bone metastatic gastric cancer cell binding to OBs and subsequent osteoclast (OC) formation.

A. PTX3 silencing reversed the BDNF-mediated induction of PTX3 mRNA expression. HTB135 cells were transfected with either PTX3-targeting or negative control siRNA and treated with BDNF (20 ng/ml) for 24 h. RT-PCR was performed to determine the level of PTX3 mRNA expression. B. PTX3 knockdown abrogated the BDNF-mediated induction of PTX3 protein expression. HTB135 cells were transfected with either PTX3-specific or negative control siRNA and treated with BDNF (20 ng/ml) for 48 h. PTX3 protein levels in CM were assayed by ELISA. C. The loss of PTX3 in HTB135 cells inhibited the BDNF-induced increase in interactions between HTB135 cells and OBs. HTB135 cells were transfected with either PTX3-targeting or negative control siRNA and treated with BDNF (20 ng/ml). The binding capacity of HTB135 cells for OBs was examined. Values represent percentages of the control (*P <0.05 in comparison with mock control). D. PTX3 silencing diminished BDNF-induced OC formation. Representative images of tartrate-resistant acid phosphatase (TRAP)-positive multinucleated cells (TRAP+MNCs) from a co-culture system are shown. HTB135 cells were transfected with either PTX3-targeting or negative control siRNA, treated with BDNF (20 ng/ml), and loaded in the upper chamber of a Transwell system. Murine bone marrow (BM) cells and OBs were co-cultured in the lower chamber. TRAP staining was performed to evaluate the formation of TRAP-positive OCs, and photographic images were obtained. E. The number of TRAP+MNCs counted from Figure 4D is depicted. The enhanced osteoclast formation induced by BDNF was reversed by PTX3 silencing (*P <0.05 in comparison with mock control). F. Loss of PTX3 reversed the BDNF-induced upregulation of receptor activator of nuclear factor kappa-B ligand (RANKL) expression. The concentration of soluble RANKL protein in the CM from Figure 4D was measured by ELISA. Data represent the means ± standard deviations (*P <0.05 in comparison with mock control). P values were obtained using Student's t test.
