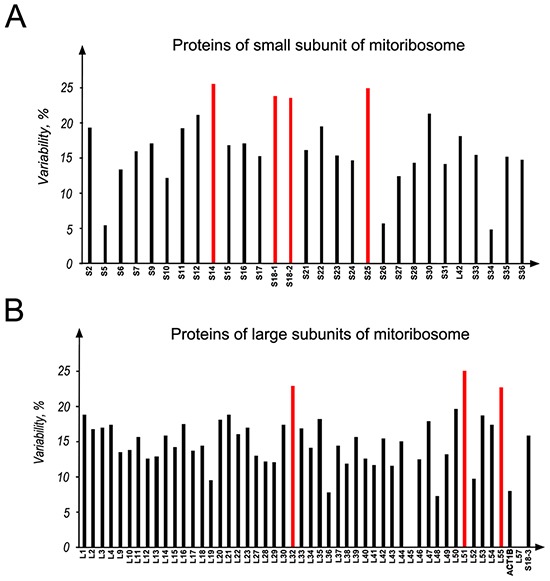
Figure 8. Mutational analysis of all the mitoribosomal whole proteome in different cancers.

A. MRPs of the small subunit; B. proteins of the large subunit of mitoribosome. Data were obtained from COSMIC database. The numbers of mutations, found for a mitochondrial ribosomal protein, were normalized to total length of that protein and the data were presented as percent of variability. Columns marked with red color are the proteins having more than 20% variability.
