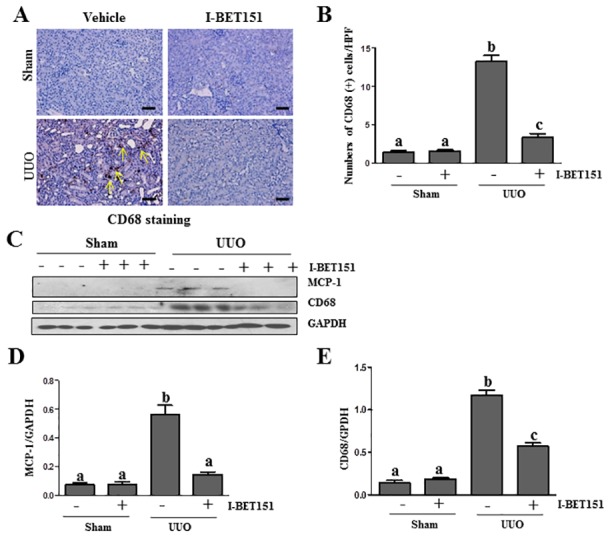
Figure 9. I-BET151 suppresses expression of MCP-1 and infiltration of macrophage in the obstructed kidneys.

A. CD68 (a macrophage marker) was stained with immunohistochemistry. B. The corresponding group data show the number of positive staining cells per high power field (HP). C. Kidney tissue lysates were subjected to immunoblot analysis with specific antibodies against CD68, MCP-1, or GAPDH. Expression levels ofMCP-1D. and CD68 E. were quantified by densitometry and normalized with GADPH. Data are means ± SEM. Means with different superscript letters are significantly different from one another (P < 0.05). Yellow arrows indicate macrophages.
