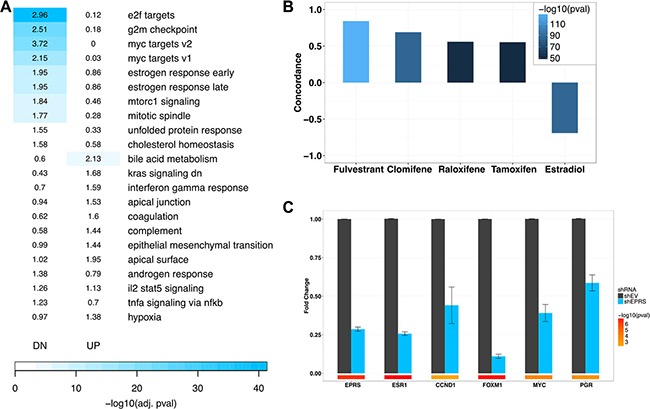
Figure 4. EPRS-regulated transcriptome.

(A) Enrichment of shEPRS differentially-expressed genes for MSigDB Hallmark genesets. Numbers represent Fold Enrichment. (B) shEPRS differential expression signature overlaps with estrogen receptor modulators. (C) QPCR validation of estrogen receptor target downregulation. Error bars represent SEM. Color bars represent -log10 (student's t-test p values). EPRS shRNA-74 shown.
