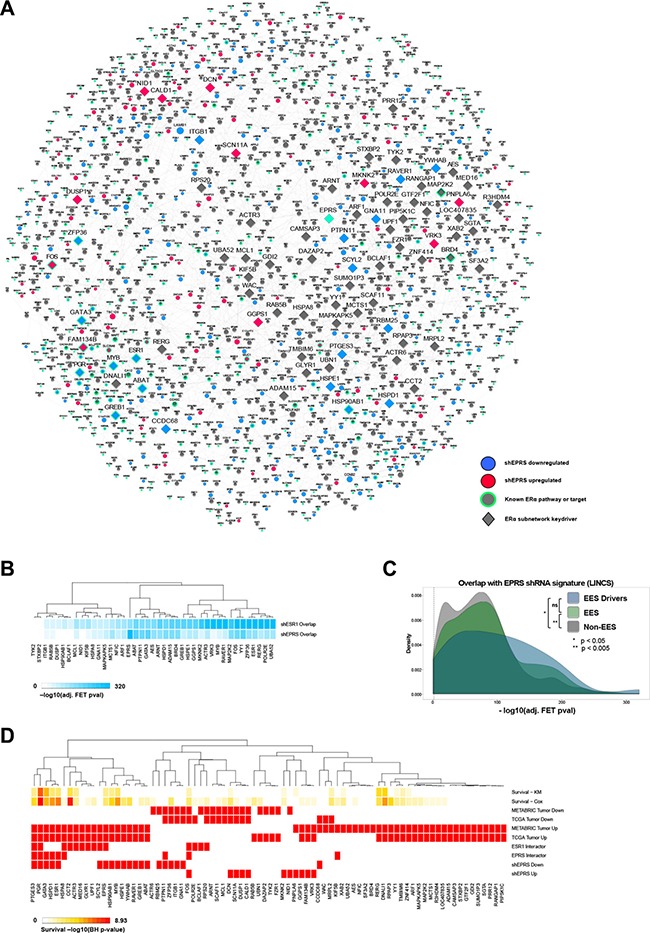
Figure 6. EPRS-regulated ESR1 network.

(A) EPRS neighborhood encompassing ESR1 target and pathway genes. (B) Overlap of keydriver shRNA signatures with those of EPRS and ESR1 for genes with perturbations available in the LINCS shRNA dataset. (C) As a group, EES driver and EES perturbation signatures show more significant overlaps with the shEPRS signatures than do non-EES genes. (D) EPRS estrogen network keydriver association with survival using Cox and KM models, differential expression in TCGA and METABRIC ER+ tumors compared to adjacent normal breast, protein interactions with ESR1 and EPRS, and differential expression following EPRS knockdown.
