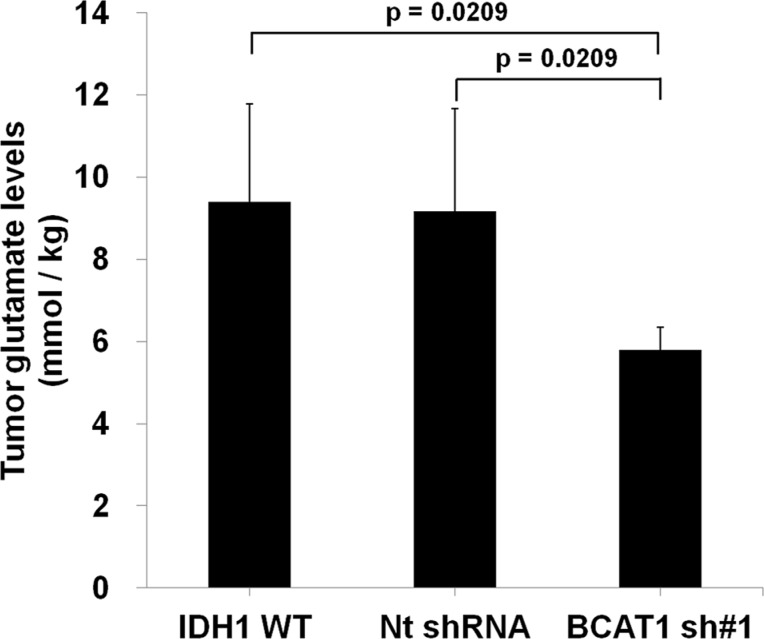
Figure 1. Analysis of tumor glutamate level of rat GBM model (n = 4 in each group) by MR spectroscopy.
The glutamate level, which was normalized by water, of BCAT1 sh#1 GBM decreased compare to IDH1 WT or Nt shRNA tumors in the rat GBM model (IDH1 WT: 10.17 mmol/kg; Nt shRNA: 9.29 mmol/kg; BCAT1 sh#1 : 5.90 mmol/kg, respectively).

