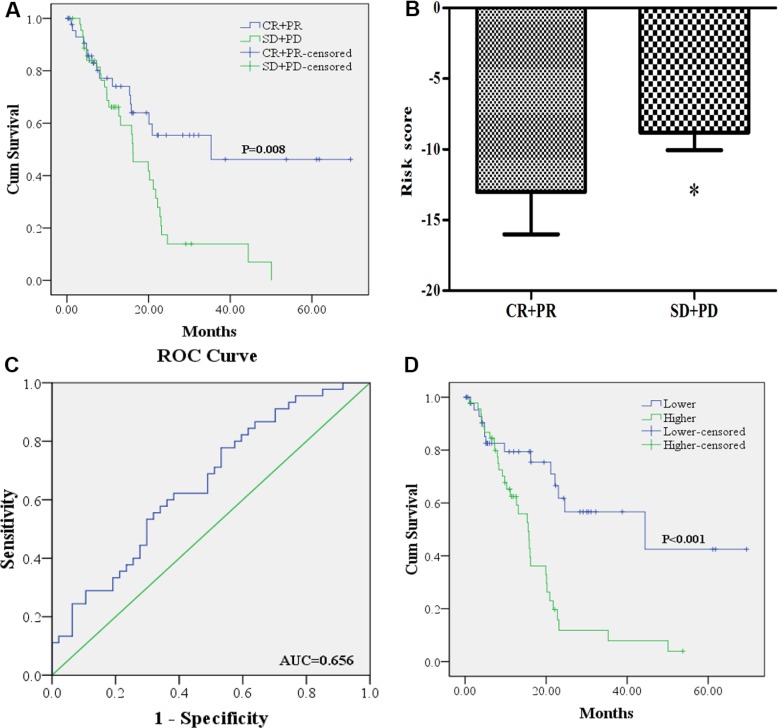
Figure 2. The association of the miRNA signature risk score with treatment outcome.
(A): 47 PC patients who achieved CR or PR (CR + PR) after treatment of first course had better OS than the 45 patients with SD or PD (SD + PD). (B) risk score of PC patients in CR + PR group was lower than those in SD + PD group. (C) receiver-operating characteristic (ROC) curve analysis of the risk score to discriminate patients with CR + PR from those with SD + PD. (D) 46 PC patients with risk score higher than the cutoff value had worse OS than the 46 cases lower than the score.

