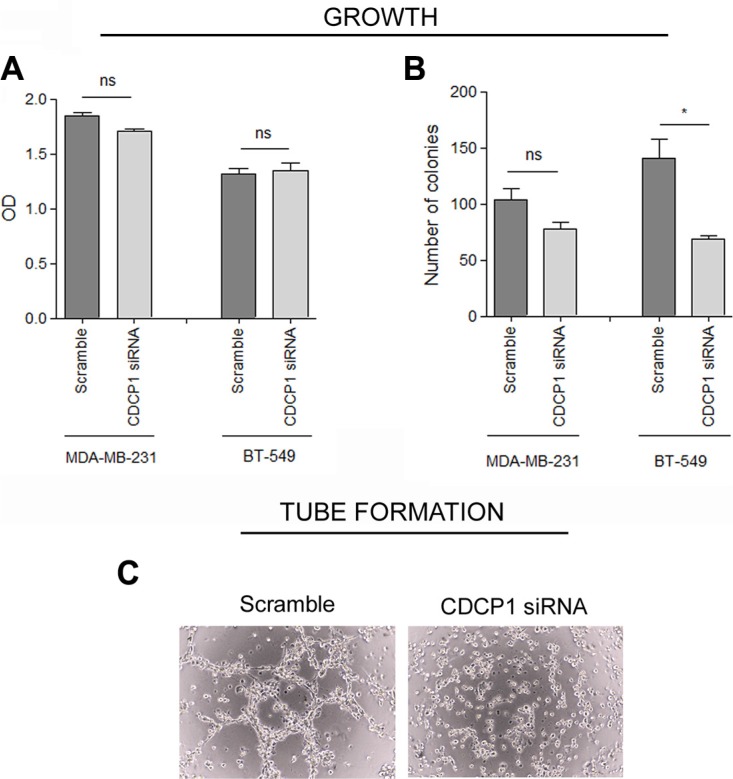
Figure 5. CDCP1 correlation with growth of TNBC cell lines.
(A) Proliferation under anchorage-dependent conditions (2D) of CDCP1 siRNA- and control siRNA-treated cells was evaluated by SRB (mean ± SEM in 3 independent experiments). (B) Anchorage-independent tumor growth (3D) was performed as described in Materials and Methods on MDA-MB-231 and BT-549 cells expressing CDCP1 or in which CDCP1 was knocked down. Colony growth was determined by counting all colonies in each well 15 days after seeding at 40x magnification. (C) Tube formation assay was performed as described in Materials and Methods on MDA-MB-231 cells expressing CDCP1 or in which CDCP1 was knocked down. *p < 0.05; ns, not significant.

