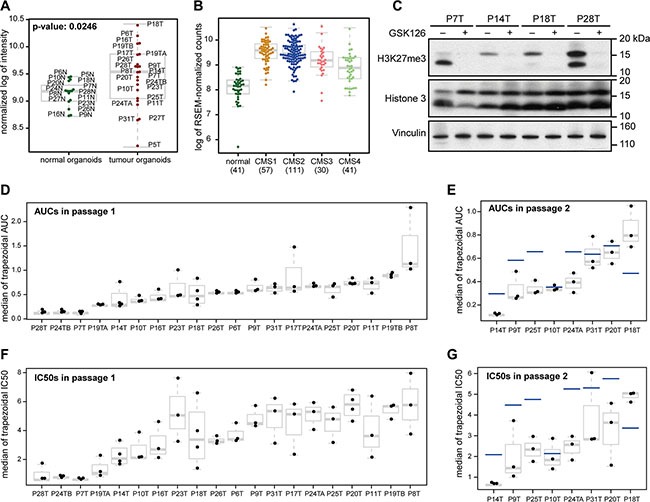
Figure 1. Organoids from different CRC tumors respond differently to chemical EZH2 inhibition.

(A) EZH2 expression in normal colonic organoids and CRC organoids. Both the mean and the variance of EZH2 expression are higher in tumor organoids as compared to normal organoids. (B) EZH2 expression in normal colon and the different molecular CRC subtypes. Expression data were taken from CRC RNA-sequencing samples from the TCGA database. CMS4 tumors express EZH2 significantly lower than other subtypes: comparing CMS1 and CMS4, p-value: 1.2 * 10−7, comparing CMS2 and CMS4, p-value: 1.6 * 10−7, and comparing CMS3 and CMS4, p-value: 0.0277. EZH2 expression in normal colon tissue was lower than tumor tissue (compared with CMS1-4 combined, p-value: 2.0 * 10−15). The numbers below the x-axis indicate the number of samples. (C) Western blot of four organoid lines that were treated with 4 μM GSK126 and harvested after fourteen days. H3K27me3 is strongly reduced in GSK126-treated versus DMSO-treated samples. (D, E) Box plot showing the trapezoidal AUCs for all replicates of 20 CRC organoids in passage 1 (D) and eight CRC organoids in passage 2 (E). (F, G) Box plot showing the trapezoidal IC50s for all replicates of 20 CRC organoids in passage 1 (F) and eight CRC organoids in passage 2 (G). Horizontal gray lines within boxes demarcate the medians, boxes delineate the middle 50% of the data, and whiskers mark 25% and 75% quartiles. The horizontal blue lines in (E and G) demarcate the medians from passage 1 for the same organoid line.
