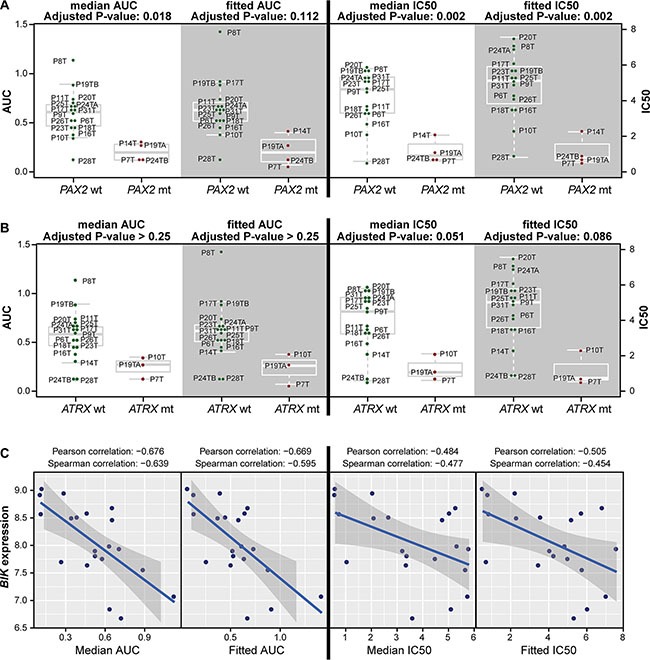
Figure 3. Response to EZH2 inhibition associates with mutation status and BIK gene expression.

(A) PAX2-mutant organoid lines are significantly more sensitive to GSK126 according to all four viability measures in passage 1. (B) ATRX-mutant organoid lines are significantly more sensitive to GSK126 for two out of four viability measures for passage 1. In A and B, four panels of box plots are shown (AUC: left two panels, IC50: right two panels; median: white background, fitted: gray background) comparing organoid lines that are wild type (left group, green dots) with organoids that are mutant (right group, red dots) for the indicated genes. Horizontal gray lines within boxes demarcate the medians, boxes delineate the middle 50% of the data, and whiskers mark 25% and 75% quartiles. (C) BIK expression inversely correlates with GSK126 response for three out of four viability measures (fitted IC50, and median and fitted AUC) in passage 1.
