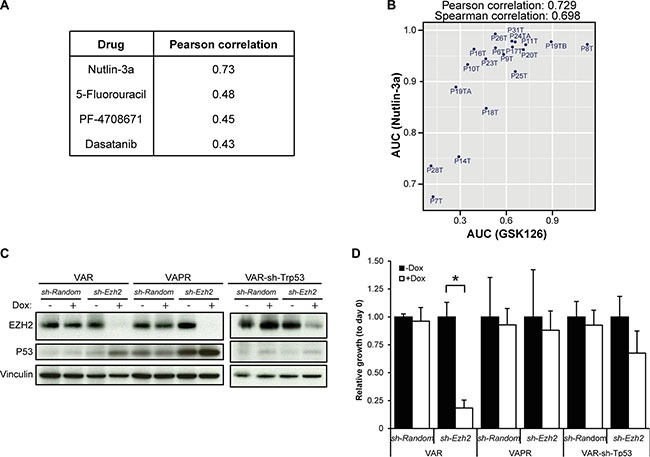
Figure 4. Sensitivity to EZH2 inhibition is correlated with activity of WT-p53 signaling.

(A) The four highest correlating drug responses with response to GSK126 (heatmap of Pearson correlations between all pairs of 84 drugs is presented in Supplementary Figure 4A). (B) Scatter plot showing the high correlation between the AUCs of Nutlin-3a and GSK126. (C) Western blot showing efficient Ezh2 KD and increased levels of Trp53 in Ezh2 KD organoids. (D) Average relative growth of VAR, VAPR and VAR-sh-Trp53 tumor organoids with or without Ezh2 KD, normalized to not-induced samples (”-Dox”, black bars). Error bars indicate standard deviation. (n = three independent experiments; 1-way ANOVA followed by Post hoc tests; *P = 6.7*10−4, only P-values < 0.05/12 are depicted).
