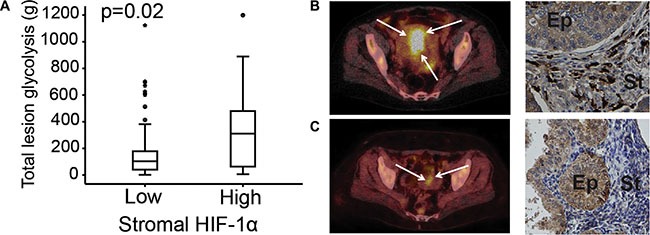
Figure 2. Stromal HIF-1α protein expression correlated to 18FDG PET/CT markers.

Total lesion glycolysis (TLG) assessed by FDG-PET/CT in primary endometrial carcinoma lesions compared to stromal HIF-1α protein expression (A). FDG-PET/CT and HIF-1α expression in a 77-year-old patient with a non-endometrioid endometrial cancer (NEEC), FIGO stage 1B: PET/CT exhibits a large FDG-avid uterine tumor (white arrows) with high TLG and the tumor had high stromal HIF-1α expression (black arrows) (B) FDG-PET/CT and HIF-1α expression in a 58-year-old patient with endometrioid endometrial cancer (EEC), grade 2, FIGO stage 1A: PET/CT exhibits a small uterine lesion (white arrows) with low TLG and the tumor had low stromal HIF-1α expression (black arrows) (C). Ep: epithelial tumor compartment. St: stromal tumor compartment.
