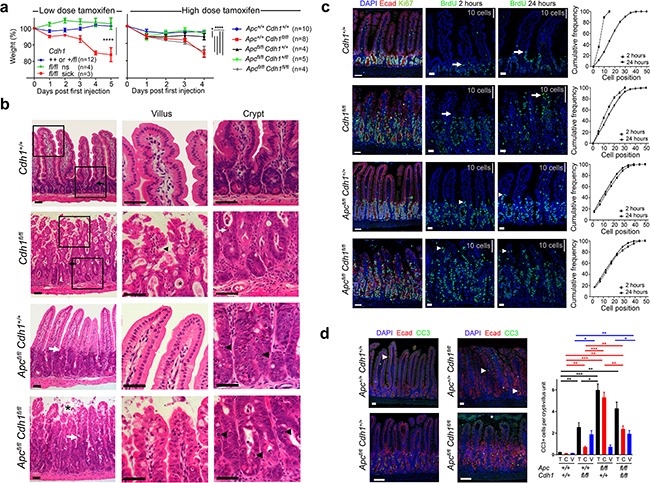
Figure 1. Intestinal phenotype following conditional Cdh1 and Apc homozygous disruption with Vil-CreERT2.

a. Animal weight (% of pre-injection) after intra-peritoneal injection with either low (40 mg.kg−1 d1-5) or high dose tamoxifen (200 mg.kg−1 d1-2), to generate Cdh1Δ/Δ with and without ApcΔ/Δ. Animals became either sick or not-sick (ns). ANOVA with Bonferroni post test for each genotype (±SEM). * p<0.05. **** p<0.001. b. H and E staining of small intestine, with high power views of villus and crypt. Black and white arrows locate the crypt-villus boundary under low power. In Cdh1Δ/Δ, black arrowhead villus tufting, *mucus pooling, white arrow apoptotic nuclei. In ApcΔ/ΔCdh1Δ/Δ, * villous shedding, black arrow heads indicate more frequent apoptotic nuclei. c. Intestinal proliferation detected with BrdU labelling following injection either 2 or 24 hours prior to dissection, compared to Ki-67. White arrows/arrowheads indicate the leading edge of BrdU labelling, grey bars indicate distance spanned by 10 crypt-villous cells. Cumulative frequency plots quantifying BrdU labelling, with cell position on the crypt-villus axis from the crypt base. d. Labelling for cleaved caspase 3 (CC3), number of positive cells per crypt-villus unit, *=shed cells in the intestinal lumen that are CC3 positive but not counted, white arrowhead positive labelling. Quantification of CC3 positive cells, total (black), crypt (red) and villi (blue), ≥3 animals per genotype and ≥20 crypt-villus units analysed per animal, ±SEM. Student's t-test, * p<0.05, ** p<0.01, *** p<0.005. Image bars 50 μm.
