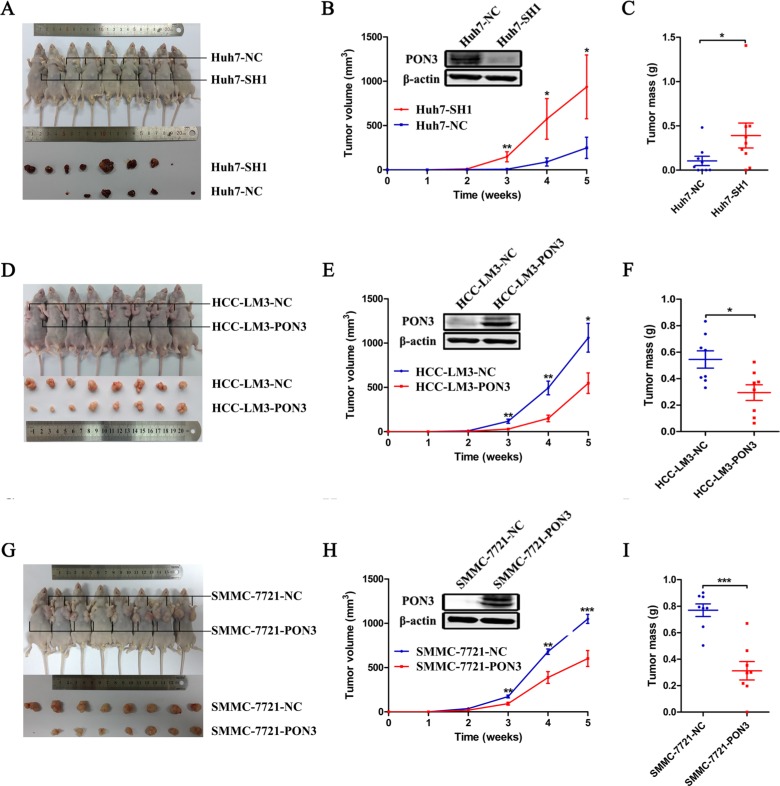
Figure 3. PON3 suppresses tumor growth in vivo.
A mouse xenograft tumor model was utilized. Mice received subcutaneously injections of 1 × 10⁷ (A–C) Huh7-SH1 knockdown and Huh7-NC control cells, (D–F) HCC-LM3-PON3 overexpression and HCC-LM3-NC control cells, or (G–I) SMMC-7721-PON3 overexpression and SMMC-7721-NC control cells. (A, D, and G) Mice and tumors were evaluated five weeks post-injections and representative images are shown. (B, E, and H) Tumor growth curve and (C, F, and I) tumor weight during the five weeks study period are shown. Data are shown as mean ± SEM. Statistically significant differences were determined by student's t-tests. *p < 0.05; **p < 0.01; ***p < 0.0001 compared with the respective controls.

