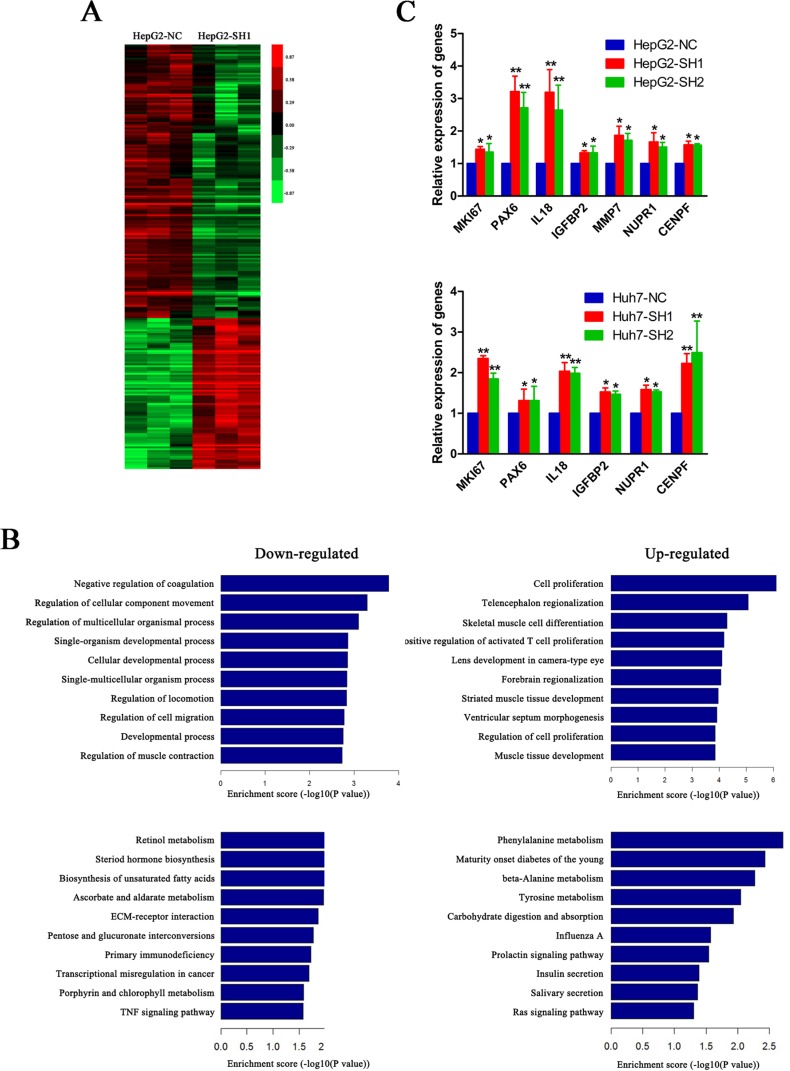
Figure 6. A cluster of pro-proliferative genes are elevated when PON3 is knocked down.
(A) A heatmap of differentially expressed genes in HepG2-SH1 cells compared with the control cells. Up- and down-regulated genes are represented with red and green colors, respectively. (B) A GO biological process analysis and pathway enrichment analysis of down-and up-regulated genes in HepG2-SH1 cells compared with the control cells. (C) Relative expressions of MKI67, PAX6, IL18, IGFBP2, MMP7, NUPR1, and CENPF in HepG2 and Huh7 cells with stable PON3 knockdown and their respective control cells were validated by qRT-PCR. *p < 0.05; **p < 0.01 compared with the respective controls. The experiments were repeated more than three times. Data are expressed as the mean ± SD and compared by student's t-test.

