
Figure 1. Constitutive activation of FAK in non-transformed MCF10A cells promotes colony formation in soft agar, EMT, migration and proliferation in 2D.
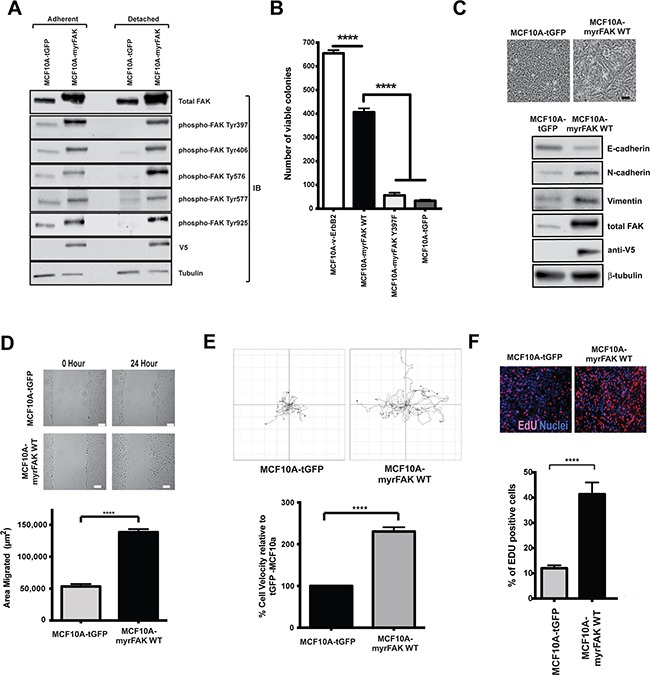
A. MCF10A mammary epithelial cells were stably infected with lentiviruses expressing either tGFP or myrFAK to mimic FAK overexpression and activation in breast cancer cells. To determine the level of FAK activation, lysates from both adherent and non-adherent cells were analysed by immunoblottting for total FAK, and FAK phosphorylation on tyrosines 397, 406, 576, 577 and 925. In tGFP expressing cells, all sites were phosphorylated on endogenous FAK in adherent cells, but lost following detachment. Phosphorylation on all sites was seen on myrFAK in both adherent and detached cells. Anti-V5 indicated the expressed myrFAK, and anti-tubulin was used as a loading control. B. MCF10A cells stably expressing v-ErbB2, myrFAK wildtype (WT), myrFAK Y397F or tGFP were plated as single cells in soft agar and grown for 7 weeks. Viable cells were stained with nitroblue tetrazolium and the number colonies quantified in three independent experiments. Data are the mean +/− SEM. Data were analysed by ANOVA. **** indicates p < 0.0001. C. Equal numbers of tGFP and myrFAK expressing MCF10A cells were cultured in 2D-monolayers. Images show confluent cultures. Scale bar = 25 μm. 24 hours post confluence, cells were lysed and analysed by immunoblotting with the indicated anti-bodies. D. Confluent 2D-monolayer cultures of tGFP and myrFAK MCF10A cells were scratch wounded, washed, and allowed to recover for 24 hours. Wound closure was quantified as the wound area occupied by cells after 24 hours. The data represent 15 fields of view from each of three independent experiments. Error bars = SEM. Significance was determined using student t-test. **** = p less than 0.0001. Scale bar = 150 μm. E. MCF10A cells expressing of tGFP or myrFAK cells were imaged every 15 minutes for 24 hours. Migration of individual cells were analysed using ImageJ. Shown are representative single cell migration tracks. For the graph, individual cell velocities were calculated and plotted relative to tGFP expressing cells. Data are the mean of >45 cells from three independent experiments. Error bars = SEM. Significance was determined using student t-test. **** = p less than 0.0001. F. Equal numbers of tGFP and myrFAK expressing MCF10A cells were pulse labelled with EdU for one hour prior to fixation, either 24 hours post plating. The percentage of EdU positive cells in each population was quantified from three independent experiments. Error bars = SEM. Significance was determined using ANOVA. **** = p less than 0.0001.