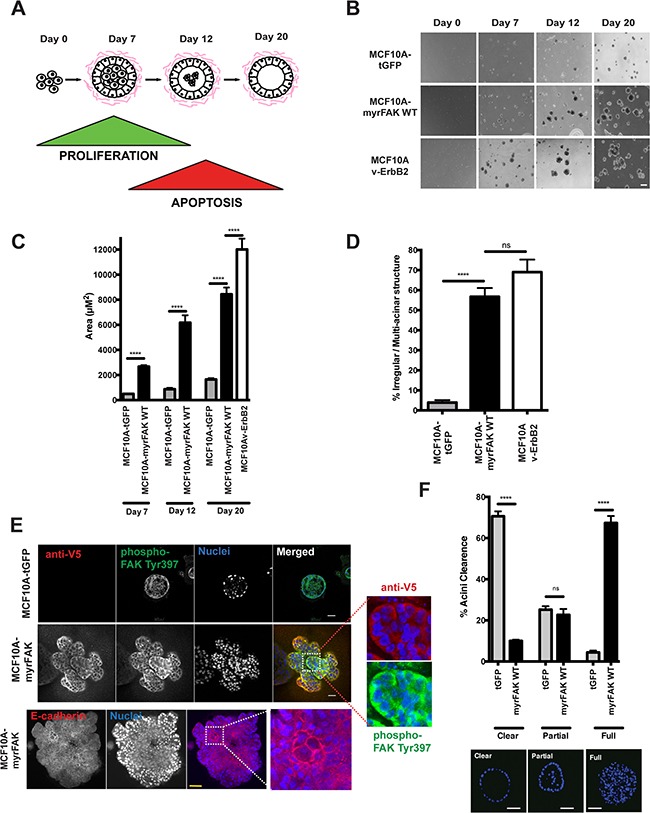
Figure 2. Constitutive activation of FAK results in aberrant acinar development in 3D-matrigel.

A. Schematic representation of MCF10A acinar morphogenesis in 3D-culture. Acini form over 20 days, due to an initial wave of proliferation followed by the central cells undergoing apoptosis. B. MCF10A cells expressing tGFP, myrFAK or v-ErbB2 were plated as single cell suspensions in matrigel for a total of 20 days. Representative images were taken on days 0, 7, 12 and 20. Scale bar = 100 μm. C. Quantification of acinar size from panel B. Acinar size was calculated using ImageJ, and represents the mean area of > 250 acini +/− SEM, from three independent experiments. D. The percentage of irregular/multilobular structures at Day 20 was calculated. Irregular structures were defined as having multiple lobules and/or a size over 4000 μm2. More the 250 structures per sample were examined, in three independent experiments. Error bars = SEM. Significance was determined using ANOVA. **** = p less than 0.0001. E. tGFP and myrFAK expressing MCF10A acini following 20 days culture in matrigel were fixed and immunostained for either anti-V5 and phospho-FAK Tyr397, or E-cadherin. Nuclei were stained with Hoechst. Equatorial confocal cross sections are shown. Scale bar = 25 μm. F. Acini from E. were quantified according to whether their lumens were clear of cells, partially filled or completely filled, independent of acinar size. Representative images of each classification are shown. Results represent mean of three independent experiments. Error bars =SEM. Data were analysed by ANOVA. **** = p < than 0.0001. Scale bar = 25 μm.
