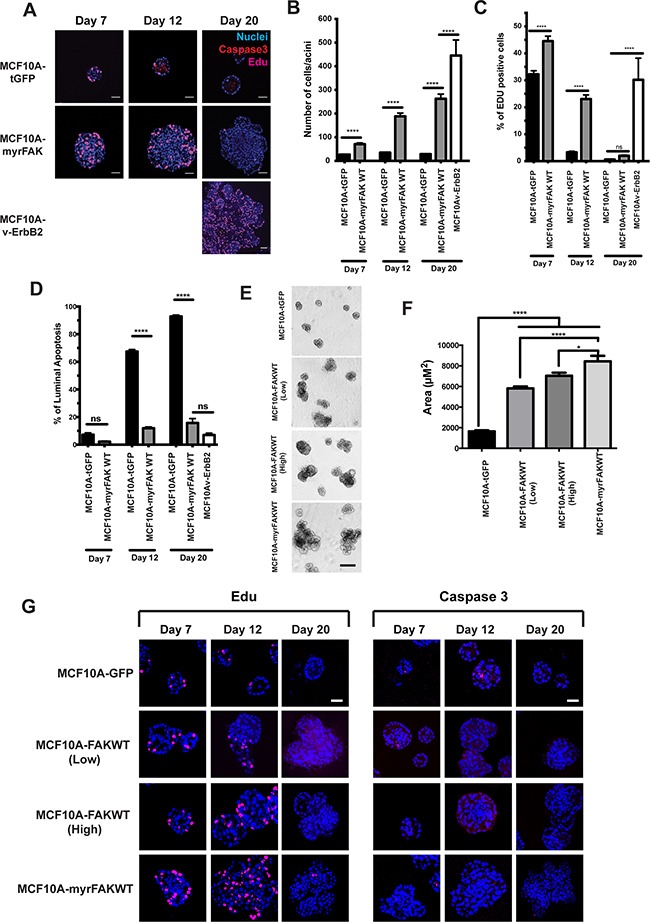
Figure 3. FAK suppresses apoptosis in 3D acini, but does not drive constitutive proliferation.

A. MCF10A cells stably expressing tGFP, myrFAK or v-ErbB2 were cultured in matrigel for up to 20 days. Cells were pulse labelled for one hour with EdU prior to fixation. Cells were immunostained for activated caspase 3 and EdU, and nuclei stained with Hoechst. Representative equatorial confocal cross sections are shown. Scale bar = 25 μm. B. Quantification of the number of cells in each equatorial cross section. Each time point represents ~ 100 acini from three independent experiments. Error bars =SEM. Data were analysed by ANOVA. **** = p < than 0.0001. C. Quantification of the percentage of EdU positive cells per acini. Data are from ~ 100 acini from three independent experiments. Error bar are SEM. Data were analysed by ANOVA. **** = p < than 0.0001. D. Quantification of the percentage of luminal cells that stain positive for activated caspase 3. Cells in the outer layer of the acini, and which would be in direct contact with the ECM, were not positive for caspase 3 and are not included in this analysis. This is particularly apparent in the tGFP expressing cells at day 12 and day 20 shown in A. Data were analysed by ANOVA. **** represents p < 0.0001. E. MCF10A cells stably expressing tGFP, myrFAK or non-myrstiolated FAK (FAKWT, both low and high expressing populations selected by FACS) were cultured in matrigel for 20 days. Representative images taken on day 20. Scale bar = 100 μm. F. Quantification of acinar size from E. Acinar size was calculated using ImageJ, and represents the mean +/− SEM, from three independent experiments. G. MCF10A cells stably expressing tGFP, myrFAK and FAKWT were cultured in matrigel for up to 20 days. Cells were pulse labelled for one hour with EdU prior to fixation. Cells were immunostained for EdU (left panel) activated caspase 3 (right panel), and nuclei stained with Hoechst. Representative equatorial confocal cross sections are shown. Scale bar = 25 μm.
