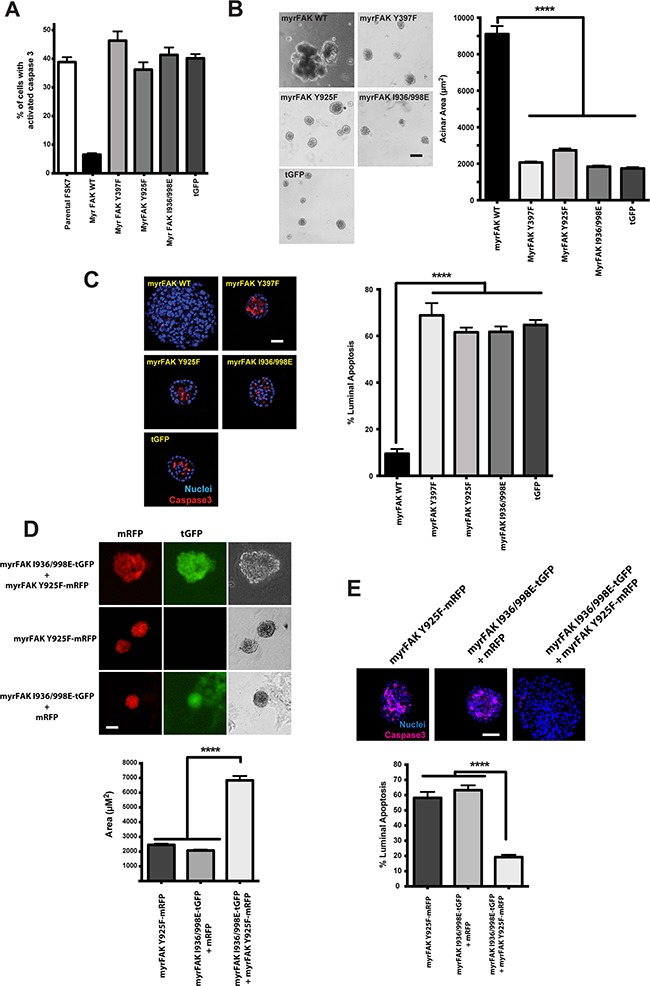
Figure 4. myrFAK suppression of luminal apoptosis requires tyrosine 925 phosphorylation and the paxillin binding site.

A. myrFAK supresses anoikis in FSK-7 mouse mammary epithelial cells. Uninfected FSK-7 cells, and those stably expressing tGFP, myrFAK wildtype (WT), myrFAK-Y397F, myrFAK-Y925F, myrFAK-I936/998E (paxillin binding defective), were detached from ECM and maintained in suspension for 24 hours. Apoptosis was quantified by active caspase 3 immunostaining. Data represent the mean of three independent experiments. Error bars = SEM. B. MCF10A cells stably expressing tGFP, myrFAK-WT, myrFAK-Y397F, myrFAK-Y925F or myrFAK-I936/998E were seeded as single cells in matrigel and cultured for a total of 20 days. Representative bright field images at day 20 are shown, and acinar area was quantified using ImageJ. Data represent the means from three independent experiments. Error bars =SEM. Data analysed by ANOVA. **** = p<0.0001. Scale bar = 50 μm. C. MCF10A cells stably expressing tGFP, myrFAK-WT, myrFAK-Y397F, myrFAK-Y925F or myrFAK-I936/998E were cultured in 3D-matrigel for 10 days, then fixed and immunostained for active caspase 3. Nuclei were stained with Hoechst. Equatorial confocal images were captured, and apoptosis of luminal cells quantified as a percentage of the total luminal cell population. Representative images are shown. Data represent the means from three independent experiments. Error bars = SEM. Data were analysed by ANOVA. **** = p < 0.0001. Scale bar = 25 μm. D. MCF10A cells were stably infected with: pCDH-myrFAKI936/998E/tGFP plus pCDH-mRFP; pCDH-myrFAK-Y925F/mRFP; or pCDH-my.rFAKI936/998E/tGFP plus pCDH-myrFAK-Y925F/mRFP. Cells were grown in 3D-matrgel for 20 days, and imaged for mRFP/tGFP. Representative bright field images at day 20 were quantified using ImageJ. Data represent the means from three independent experiments. Error bars =SEM. Data analysed by ANOVA. **** = p<0.0001. Scale bar = 50 μm. E. Cells from D. were cultured in 3D-matrigel for 10 days before quantifying apoptosis by immunostaining for active caspase 3. Data represent the means from three independent experiments. Error bars = SEM. Data were analysed by ANOVA. **** = p < 0.0001. Scale bar = 25 μm.
