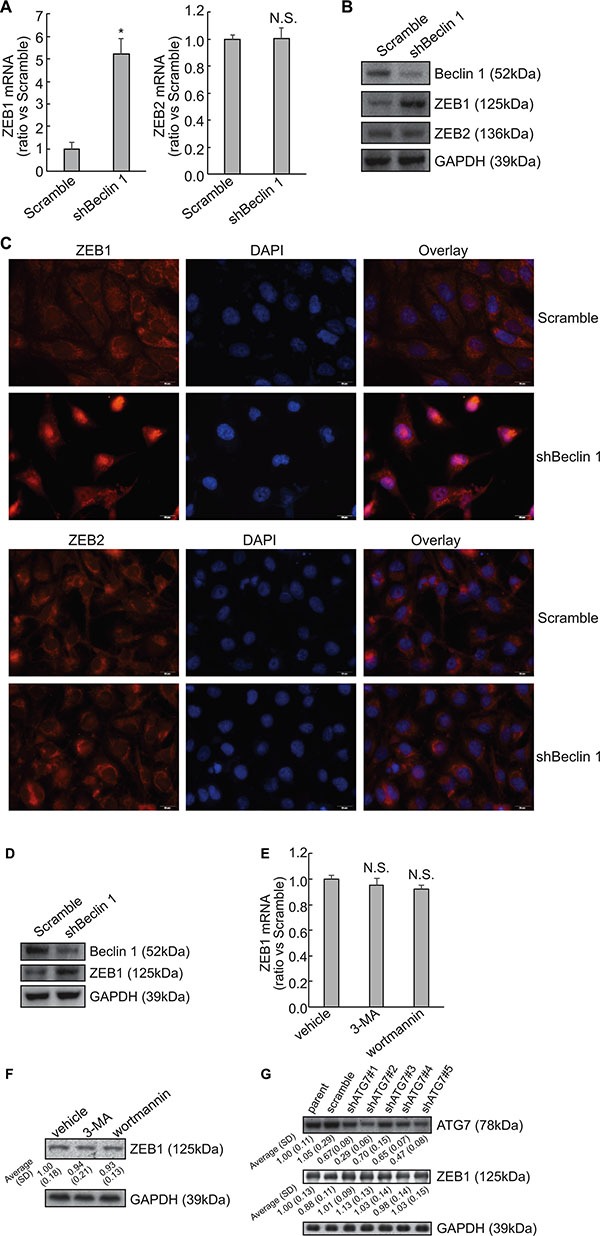
Figure 2. Upregulation of ZEB1 by Beclin 1 knockdown in thyroid cancer cells.

(A) Total RNA was extracted from FRO cells transfected with scramble or shBeclin 1, and mRNA levels were analyzed using Quantitative PCR. (B) Total protein was extracted from FRO cells transfected with scramble or shBeclin 1, and protein levels were analyzed using Western blot. (C) Immunofluorescence of ZEB1 and ZEB2 was performed in the indicated cells. (D) Total protein was extracted from KTC3 cells transfected with scramble or shBeclin 1, and protein levels were analyzed using Western blot. (E–F) FRO cells were treated with vehicle, 5mM 3-methyladenine (3-MA) or 5 μM wortmannin, ZEB1 mRNA (E) and protein (F) expression was analyzed using Quantitative PCR and Western blot, respectively. (G) FRO cells were transfected with specific shRNAs against ATG7 (shATG7) for 48 h, ZEB1 expression was analyzed using Western blot. Similar data was obtained from three independent cell preparations. N.S., not significant; *P < 0.01.
