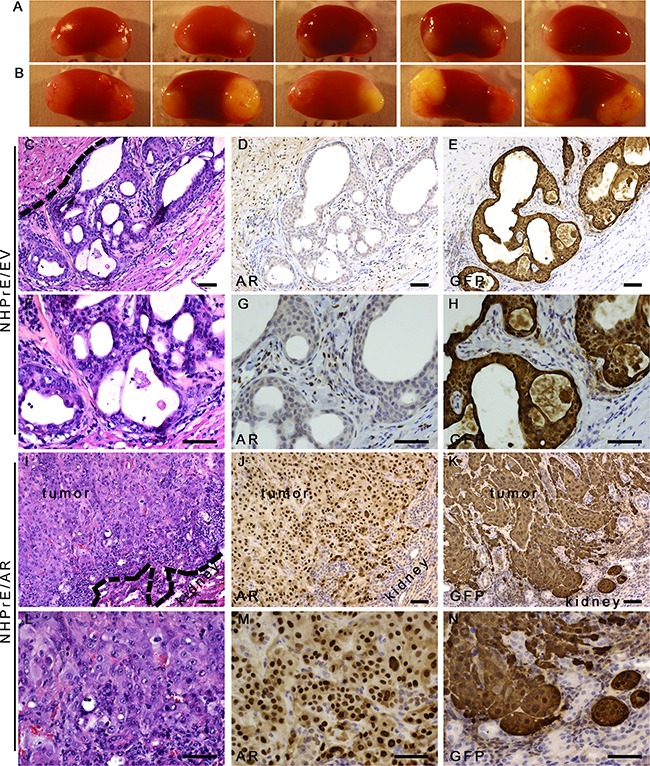
Figure 4. Ectopic-expression of AR transformed NHPrE1 cells in vivo.

NHPrE1/EV or NHPrE1/AR cells were recombined with rat UGM and grafted in vivo. A and B. gross morphology of renal subcapsular grafts. A, grafts derived from empty vector control NHPrE1/EV cells showed limited growth; B, grafts derived from NHPrE1/AR cells grew extensively. C-N. H&E and IHC staining performed on serial sections derived from NHPrE1/EV (C-H) or NHPrE1/AR (I-N) grafts. F-H and L-N are higher magnification pictures of C-E and I-K, respectively. Broken lines in panels C and I indicate the interface between the NHPrE1 grafts and host kidneys. While a clear boundary existed between the NHPrE1/EV graft and host kidney (C), NHPrE1/AR tumors focally invaded renal parenchyma (I-K). While epithelial cells in NHPrE1/AR grafts were positive for AR by IHC staining (J and M), epithelial cells in NHPrE1/EV graft showed little AR immunoreactivity (D and G). Stromal cells in NHPrE1/EV grafts (derived from rat UGM) were positive for AR staining (D and G). Epithelial cells in NHPrE1/EV grafts showed positive IHC staining for GFP and formed glandular structures (E and H); whereas GFP-tagged NHPrE1/AR cells (K and N) formed invasive carcinomas. Scale bars represent 25 μm.
