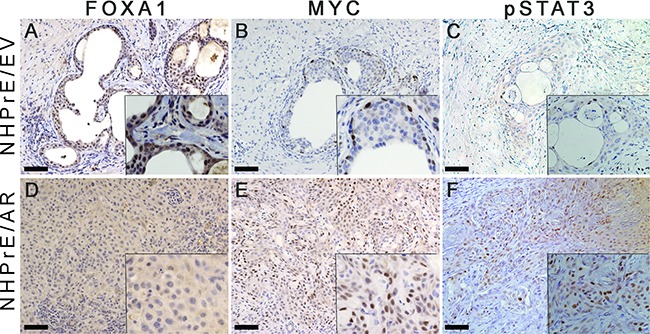
Figure 6. Expression of MYC and pSTAT3, but not FOXA1 was increases in NHPrE1/AR grafts.

IHC staining for FOXA1, MYC, and pSTAT3 was performed on serial sections derived from NHPrE1/EV and NHPrE1/AR grafts. Insets in each panel are higher magnification photomicrographs. While NHPrE1/EV grafts showed weak IHC staining for FOXA1 A. FOXA1 was not expressed in the majority of epithelial cells in NHPrE1/AR grafts D. While only a few basal cells in NHPrE/EV grafts displayed immunoreactivity MYC B. MYC was highly expressed in tumor cells from NHPrE1/AR grafts E. Malignant cells in some areas of NHPrE1/AR grafts were also positive for pSTAT3 F. whereas pSTAT3 levels were negligible in epithelial cells of NHPrE1/EV grafts C.
