
Figure 2. Effects of Ibrutinib/Nutlin-3 combination on cell cycle and apoptosis in B leukemic cell lines.
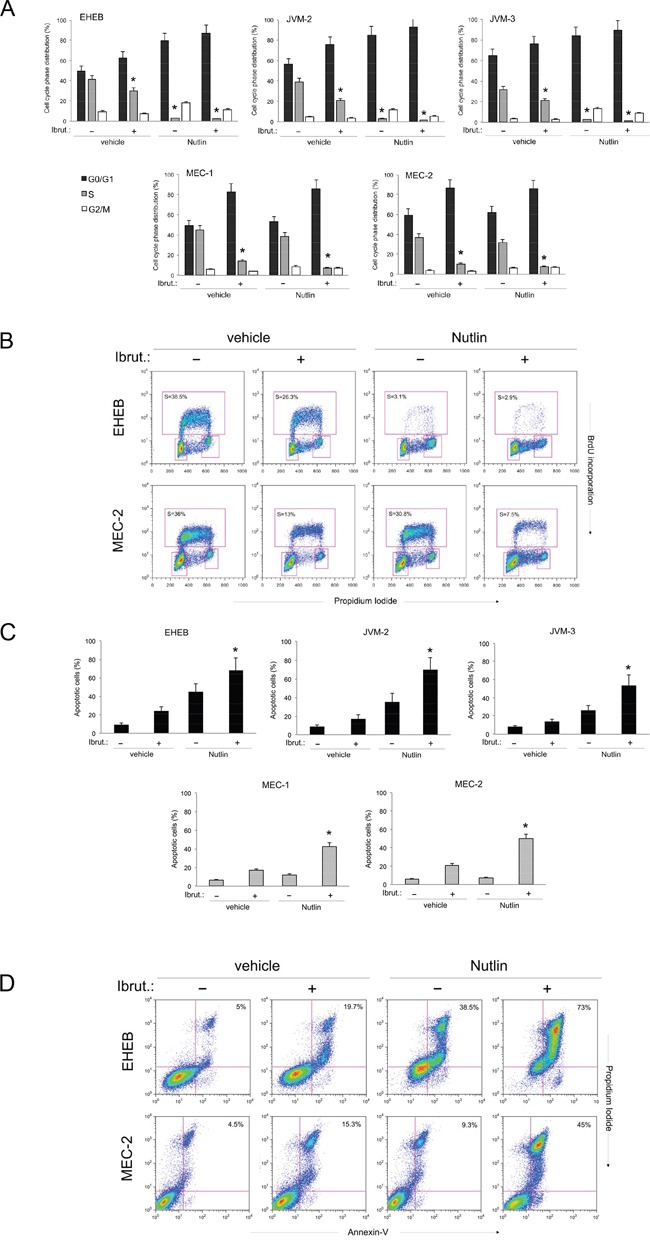
The p53wild-type (EHEB, JVM-2, JVM-3) and the p53mutated (MEC-1, MEC-2) leukemic cells were exposed to Ibrutinib (10 μM) and Nutlin-3 (10 μM) used either alone or in combination, before flow cytometric analysis of cell cycle progression A-B and apoptosis induction C-D, evaluated after 24 and 48 hours, respectively. In A. cell distribution in the different phases of the cell cycle was calculated from the flow cytometric dot plots after BrdU/PI staining and is expressed as percentage of the total population. The asterisk indicates p<0.05 respect to control vehicle. In B. representative flow cytometric dot plots of cell-cycle profiles were analyzed by BrdU incorporation after the indicated treatments. The rectangles represent the cells in the different (G0/G1, S, G2/M) phases of the cell cycle and the percentage of cells in S-phase is indicated for each treatment. In C. induction of apoptosis was calculated as percentage of Annexin V/PI double positive cells on the total population for each treatment. The asterisk indicates p<0.05 respect to single treatments. In D. representative plots of apoptotic cells were analyzed by flow-cytometry following Annexin-V/PI staining. The percentage of apoptotic cells is indicated for each treatment. In A and C, data are reported as the mean±SD of results from at least three independent experiments.