
Figure 3. Effects of Ibrutinib/Nutlin-3 combination in primary B-CLL patient cell cultures.
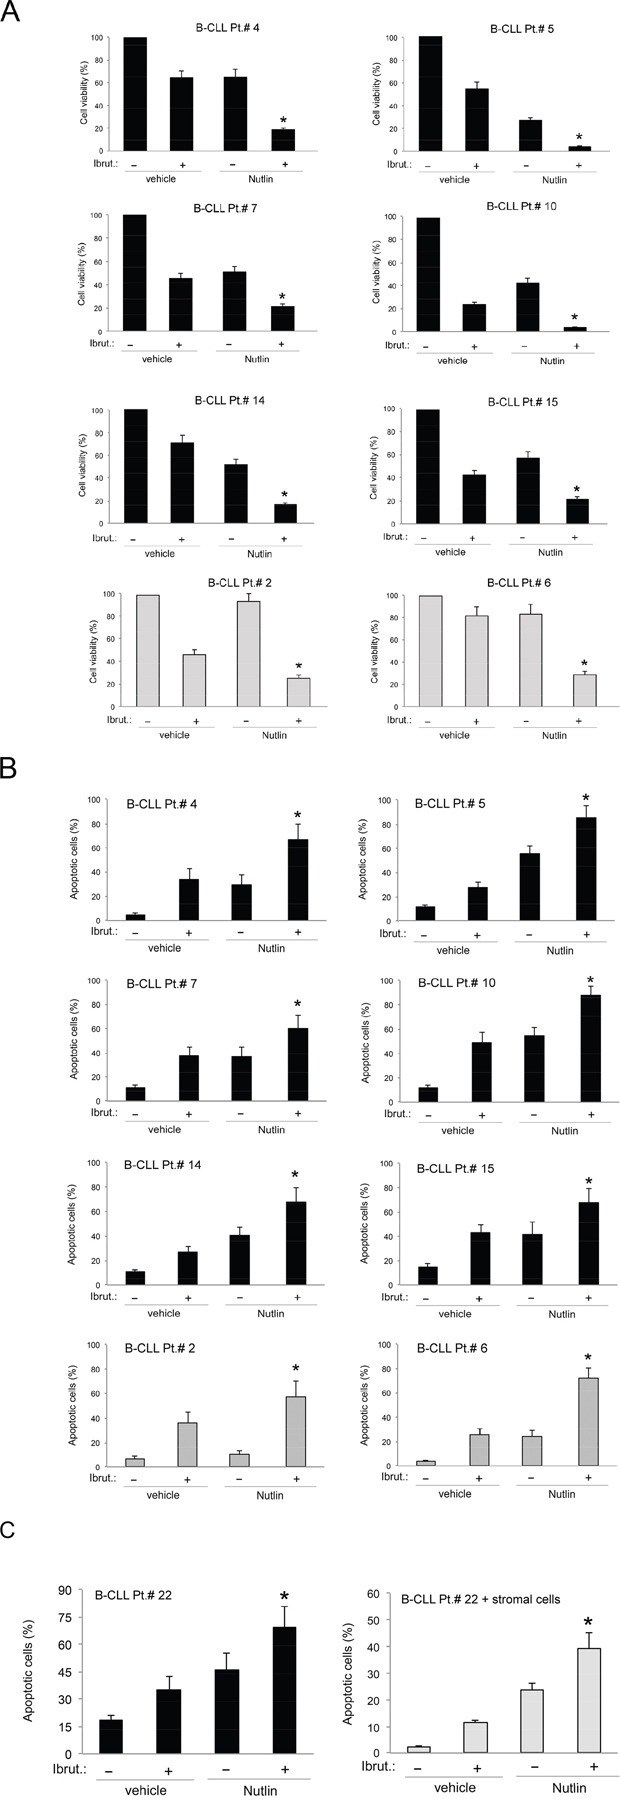
B-CLL patient (Pt.) samples were exposed to Ibrutinib (10 μM) and Nutlin-3 (10 μM) used either alone or in combination for 24-48 hours. In A. cell viability in response to each treatment was calculated as percentage with respect to the control untreated cultures (set to 100% for each primary sample). In B. induction of apoptosis was calculated as percentage of Annexin V/PI double positive cells on the total population. In A and B, p53wild-type (black) and p53mutated (gray) B-CLL patient samples are shown. In C. induction of apoptosis was calculated as percentage of Annexin V/PI double positive cells on the total population of cells treated either in suspension or in presence of a monolayer of stromal cells mimicking the microenvironment. In A, B and C, data are reported as the mean±SD of results from at least three independent experiments. Representative primary B chronic lymphocytic leukemia samples are shown. The asterisk indicates p<0.05 respect to single treatments.