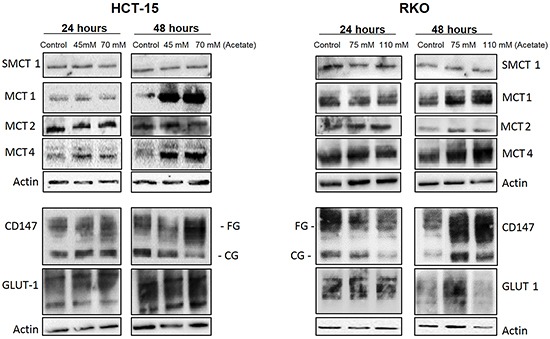
Figure 4. Characterization of MCTs expression and other glycolytic markers in CRC cells after acetate treatment.

HCT-15 and RKO cells were incubated with acetate (45 mM and 70 mM for HCT-15 cells; 75 mM and 110 mM for RKO cells, respective doses for the IC30 and IC50) or with fresh medium (as negative control) for 24 and 48 hours. Western blotting images of the SMCT1, MCT1, MCT4, MCT2, CD147 and GLUT-1 expression. β-actin was used as loading control. A representative experiment of at least three independent experiments is shown.
